

What Are Technical Bitcoin Indicators?
Technical indicators are tools used in technical analysis that aid traders in their endeavor to predict price movements.
Typically, this form of analysis uses historical price data formulated into mathematical models around predicting price action, and these become our ‘indicators.’
The data is visualized into graphs, which are overlaid on to the desired market, or positioned alongside it.
Can Indicators Predict the Future?
In short, no. But they provide traders with enough insight to observe trends and assess the validity of the indicators available.
Following Newtonian physics, indicators follow a simple path: Price moves have momentum, and the more momentum a move has, the harder it is to stop, and vice versa. This concept is summed up in the famous adage, “The trend is your friend.”
For example:
If you were to sell 10,000 Christmas trees on the first of December and 11,000 the next day, it’s safe to say that business will continue to rise or remain at this level, things are looking good.
But toward Christmas day, sales are likely to be declining and interest is low, sales have gone from a high of 11,000 a day, to 5,000 a day, indicating that the trend is no longer on the up, the tree business may be running out of steam and so it may be time to sell the remaining stock asap.
In this simple sense, indicators leverage graphs and formulas to help traders see the trends and “see” what buyers and sellers could potentially to do next.
Top Five Bitcoin Indicators
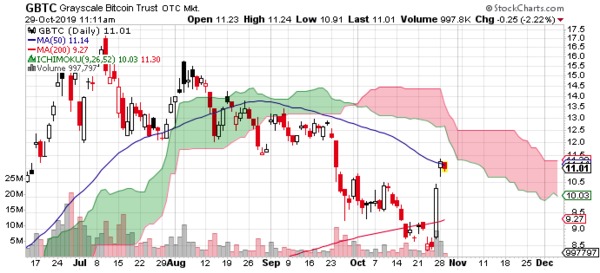
1. Ichimoku Clouds
An Ichimoku Cloud is made up of five lines, each displaying averages over certain periods of time which are determined by the trader. When two of the lines cross, this area between them is shaded in, forming a “cloud”.
When the current price is above the cloud, this means that the trend is up; conversely, when the price is below the cloud, the trend is down.
If the cloud is also moving in the direction of the price, it can be assumed that the trend is strong.
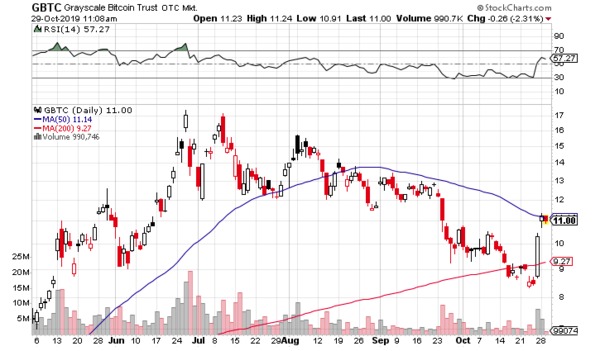
2. Relative Strength Index (RSI)
The RSI indicator is perhaps one of the simplest; it shows if an asset is overbought or oversold.
By using historical data, the RSI attempts to determine the overall demand for an asset. It does so by assessing if an asset has been purchased so much that there is likely to be a downward ‘correction’ in price or, the opposite.
This indicator has two lines, one at 30 and the other at 70. When the reading is above 70, it is likely that the price will drop, and when below 30, the price is assumed to be on the rise.
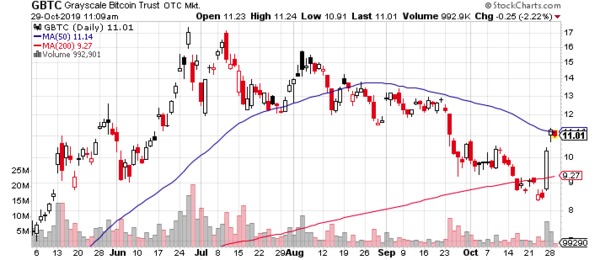
3. Moving Averages (MA)
Prices can spike in one direction or the other. These are usually misinterpreted as ‘reversals’ or continuations of a trend.
An MA indicator calculates the average price of a period of time and recalculates this as time goes on, though it is worth noting that short-lived spikes tend to have little effect on MA indicators set for the longer time frames.
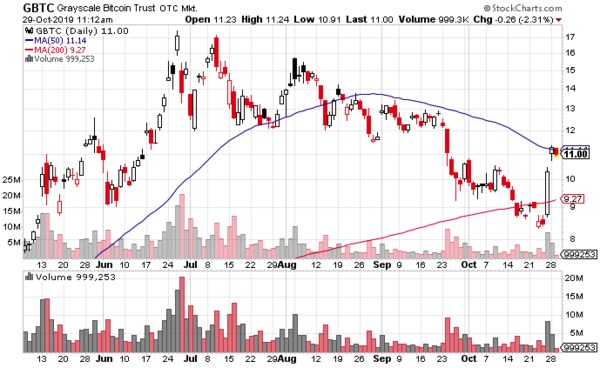
Observing graphs showing moving averages can be useful when determining ‘support’ and ‘resistance’ levels; Support describes a barrier at a lower point in which the price is less likely to sustain a continued move. Resistance is the opposite, meaning the action is above the price, which it is unlikely to remain at.
As shown in the graph below, a MA makes these levels a little clearer.
4. Fibonacci
The famous Fibonacci indicator is similar to that of MA in that it is useful when predicting the parameters of price action. Unlike the other slightly more calculated indicators, Fibonacci ratios naturally occur in nature, art, and human decisions.
Akin to a self-fulfilling prophecy, the Fibonacci ratio follows the notion that: People think it will happen, so they make it happen with the way they choose to trade.
The levels are sometimes met partially due to some self-fulfilling prophecy. When the price moves suddenly, it will often retrace, or make a retreat back toward the trend.
5. Volume
This could be considered one of the most underrated and valuable bitcoin indicators available.
Volume displays how many people are buying and selling bitcoin, simple right? With it, you can see the buy/sell tug-of-war with every green and red candle on the page.
Remember, if there is a significant price move in any direction, it only has momentum if there are enough people behind it. Consider the number of traders behind a movement in price as the “mass” in the momentum, the greater the number, the more likely the price will move in favor of the majority.
To stay up to date with the latest developments in the digital asset market subscribe to Bitcoin Market Journal today.
