
The big question for every bitcoin trader is: “What is the best bitcoin technical indicator?”
Well, why not take a look at the simple truths depicted via market support (demand) and resistance (supply) levels? These can be among the most powerful, and predictive, of all the high-tech market tools within your grasp. Even better, most of these tools likely come as standard equipment in your favorite trading platform.
Here’s a simple, yet effective way to use three common technical tools to locate high-probability support and resistance zones in bitcoin and Ethereum. You can also use this technique on any altcoin chart (daily, weekly, monthly, quarterly) with adequate trading volume.
An Official Definition: What Are Support and Resistance?
According to Investopedia.com:
“Support and resistance represent key junctures where the forces of supply and demand meet. In the financial markets, prices are driven by excesses of supply (down) and demand (up). Supply is synonymous with bearish, bears and selling. Demand is synonymous with bullish, bulls and buying.”
That’s a superb explanation of the key forces that move the bitcoin and altcoin markets. How can you apply this general knowledge with a specific trade setup that you can deploy time and again?
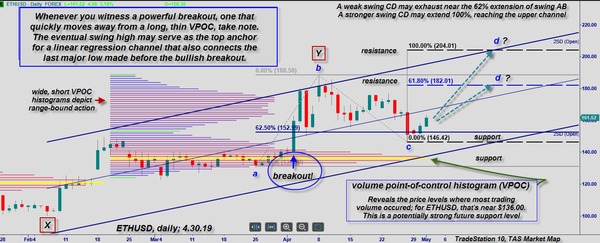
Take a look at this daily Ethereum chart:
Three’s Company
The three support and resistance tools in the above chart are:
- A volume point-of-control (VPOC) histogram
- A linear regression channel
- A Fibonacci retracement and expansion grid
Here’s a quick look at the main purpose of each indicator when using them in concert:
VPOC
The volume point-of-control histogram depicts the prices where the majority of trading volume happened. The VPOC in this example uses 50 days of Ethereum data to form each histogram. The longer and thinner the histogram is, the higher the probability of a sustained market move on a strong break away from it. Wider and shorter VPOCs typically identify major congestion zones, typically manifesting as range-bound price action on your chart.
Linear regression channel
Market moves that extend to either channel line will typically revert to the mean (centerline of the channel). At major trend reversals, prices may even move to the opposite channel. The linear regression channel is a great way to stay abreast of mean-reversion trade opportunities.
In the above example, you want to focus on any Ethereum moves that touch the upper channel, an extended price target.
Fibonacci retracement and expansion
Once you’ve plotted a logical regression channel, your next task is to ID a proportional retracement of Ethereum back toward the 50 percent or 62 percent Fibonacci retracement of swing AB. If and when you get a bullish reversal signal after such a correction, you may be in prime shape to ride a move higher to key Fibonacci expansion ratios.
In the above chart, these ratios are plotted as 61.8 percent and 100 percent of the length of swing AB. They are not ‘magic’ numbers, but since many bitcoin and altcoin traders monitor such ratios, it pays to use them as potential price targets.
The Big Idea
The big idea here is simple. Whenever you witness a powerful breakout from a long, thin VPOC, take special note of the previous major low (point X) and subsequent major high (point Y).
These two points (preferably at a near-equal distance on either side of the VPOC) become the anchors upon which you can plot a linear regression channel. Make sure your channel lines extend to the right, as this will help you locate future supply and demand areas.
If a proportional correction takes price back down to around the 50 percent or 62 percent Fibonacci retracement of breakout swing AB, begin looking for a bullish reversal as your buy signal. A simple break back above the highest high of the previous three price bars can serve as an effective entry trigger.
AB =CD
Bitcoin and altcoin technicians often compare the length of related market swings to help forecast future reversal points. The ‘ABC’ pattern above (with swing BC ending near the 62 percent retracement of swing AB) lends itself perfectly to projecting a couple of swing termination points for swing CD.
It is very common to witness a swing AB that is nearly identical in length to swing CD, hence the AB=CD terminology. Using that formula, a 100 percent expansion of swing AB (and added to the swing CD low price of $146.10) produces an Ethereum price target of $204.01. Multiplying swing AB by 61.8 percent yields a more modest price target of $182.01.
Will either price level be reached? No one knows for certain, and as with all technical analysis tools, this method cannot provide 100 percent accuracy. However, the bullish bias for ETHUSD is evident. Price is making a series of higher swing highs and higher swing lows, and its linear regression channel is also rising.
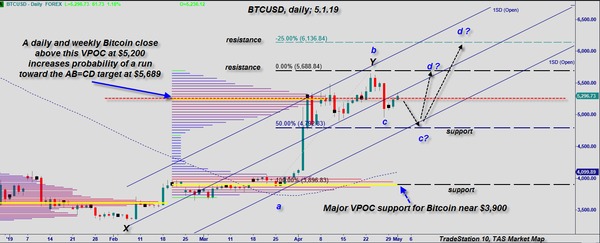
Bitcoin: A Similar Dynamic in Play
Bitcoin’s daily graph looks even more bullish than that of Ethereum.
The Lines are Drawn
Thus far, bitcoin hasn’t retraced breakout swing AB by 50 percent, much less 62 percent. So there’s no ‘official’ long entry with this technique yet. With bitcoin trading right at the VPOC (dashed red line), the coin is in a potentially explosive posture, direction unknown. However, a combined daily/weekly close above or below the VPOC line may trigger the next surge higher or lower.
Strongly trending markets tend to make shallow (24 percent to 38 percent) Fibonacci retracements, so it’s possible that bitcoin will never see the 62 percent retracement as this move plays out. Monitor the price action near $5,689 and then $6,137 for profit-taking opportunities, should this move catch a strong bid.
Conversely, if bitcoin breaks down and drifts lower to the 62 percent retracement line, you’ll be offered a lower-risk long entry zone. Keeping your per-trade account risk at one percent or less can help keep you in the trading game, no matter if the trade is a winner or a loser.
Science, Art, and Intuition
The above support/resistance examples are simple to understand and easy enough to locate, provided you have several hours per week to visually scan your favorite charts. However, your real breakthrough as a bitcoin/altcoin trader will arrive once you develop your inner sense of what looks ‘right’ and ‘wrong’ on any given chart.
The more time you take to thoughtfully scan your charts, take notes, and observe which support/resistance tools work, the more effective your trading edge can be. Never forget, the best bitcoin trading indicator is the one that you completely understand and can effectively leverage to achieve trading success.
For more information about investment in the digital asset space, take a moment today to subscribe to the Bitcoin Market Journal newsletter to join a community of thousands of like-minded investors.
