

Sir John Templeton (the other Sir John) is often called the “greatest global stock picker of the century.”
He built his fortune by swimming against the current and focusing on undervalued assets, investing not on gut feeling but by using a mathematical approach to spot good bargains.
 Sir John famously invested in Japan after World War II, when the country was in ruins. Imagine buying a building for a fraction of what it would cost to rebuild it. That was the idea that let Sir John find great Japanese companies that would eventually rise from the ashes and net him a fortune.
Templeton would have loved crypto, because today, these kinds of undervalued crypto assets are everywhere.
Why? Because very few investors think of cryptos like “companies,” and their tokens like “stocks.” This is a huge advantage for those of us who do. (See our Investing Approach.)
While the vast majority of crypto runs on FOMO and FUD, we are invest on more than just feelings. We invest on facts and fundamentals.
This gives us a huge investing advantage, especially during crypto bear markets (which happen all the time). While everyone else runs for the exit, we can buy great crypto companies at deep discounts, just as Sir John bought into Japan.
Quantitative analysis in crypto doesn’t require advanced math – just the ability to engage with some numbers, and compare different companies against each other.
In an industry where almost nobody looks at the numbers beyond “price go up,” a little bit of effort goes a long way.
In this piece, we’ll outline three simple numbers that you can use to identify crypto companies with strong user bases, and clear pathways to future revenue generation.
(And remember, quantitative analysis is only one side of the coin. The other side is qualitative analysis, which we cover here.)
Where Do I Find These Numbers?
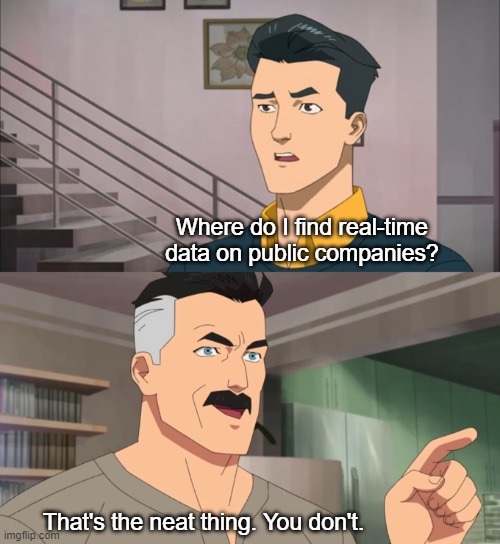
One of the neat things about blockchain technology is that you can see crypto numbers in real time. In traditional publicly-traded companies, you can’t.
If you want to know the daily active users for Facebook, for example, you have to wait for the company’s quarterly earnings report, weeks or months after the fact.
With blockchain, you can see users in real time.
This kind of radical transparency is very exciting for investors, because there’s nowhere to hide. Either the numbers look good, or they don’t.
While there are many platforms that offer these numbers, our current favorite is Token Terminal, which gives them to you in an easy-to-use dashboard. (Their investing philosophy also aligns with ours.) We’ll use their data to look at our three most important metrics.
Metric 1: Daily Active Users
If cryptos are like companies, Daily Active Users are like the number of customers.
Imagine a busy coffee shop. The more customers that come through the doors each day, the more successful the shop is likely to be. But a coffee shop with very few customers is unlikely to stay in business for long, no matter how much hype it got when it first launched.
It’s so simple that we shouldn’t have to explain it: if a crypto company has no users, it’s not a great long-term investment. Companies need customers, and crypto companies are no different. Yet almost nobody thinks this way.
The metric we use is Daily Active Users, which is just a running count of how many people use the crypto project or platform each day. Here’s the DAU for Ethereum (ETH):
Long term, Ethereum DAU (i.e., its customers) are healthy, strong, and growing.
And here’s the DAU for Uniswap (UNI):
DAU shows us that Uniswap has developed a real product and found a real market.
There’s another reason that DAU is our most important metric, and that is the principle of network effects.
The classic example of network effects is a social media platform like Facebook. When Facebook started at Harvard with just Zuckerberg and a few friends, it wasn’t very valuable. But the more people who joined, the more valuable it became.
In fact, the more people who joined, the more valuable Facebook became for everyone already on Facebook.
This is kind of a magical concept that’s so important I’ll repeat it: the more people who join a network company, the more valuable the network becomes for everyone on the network.
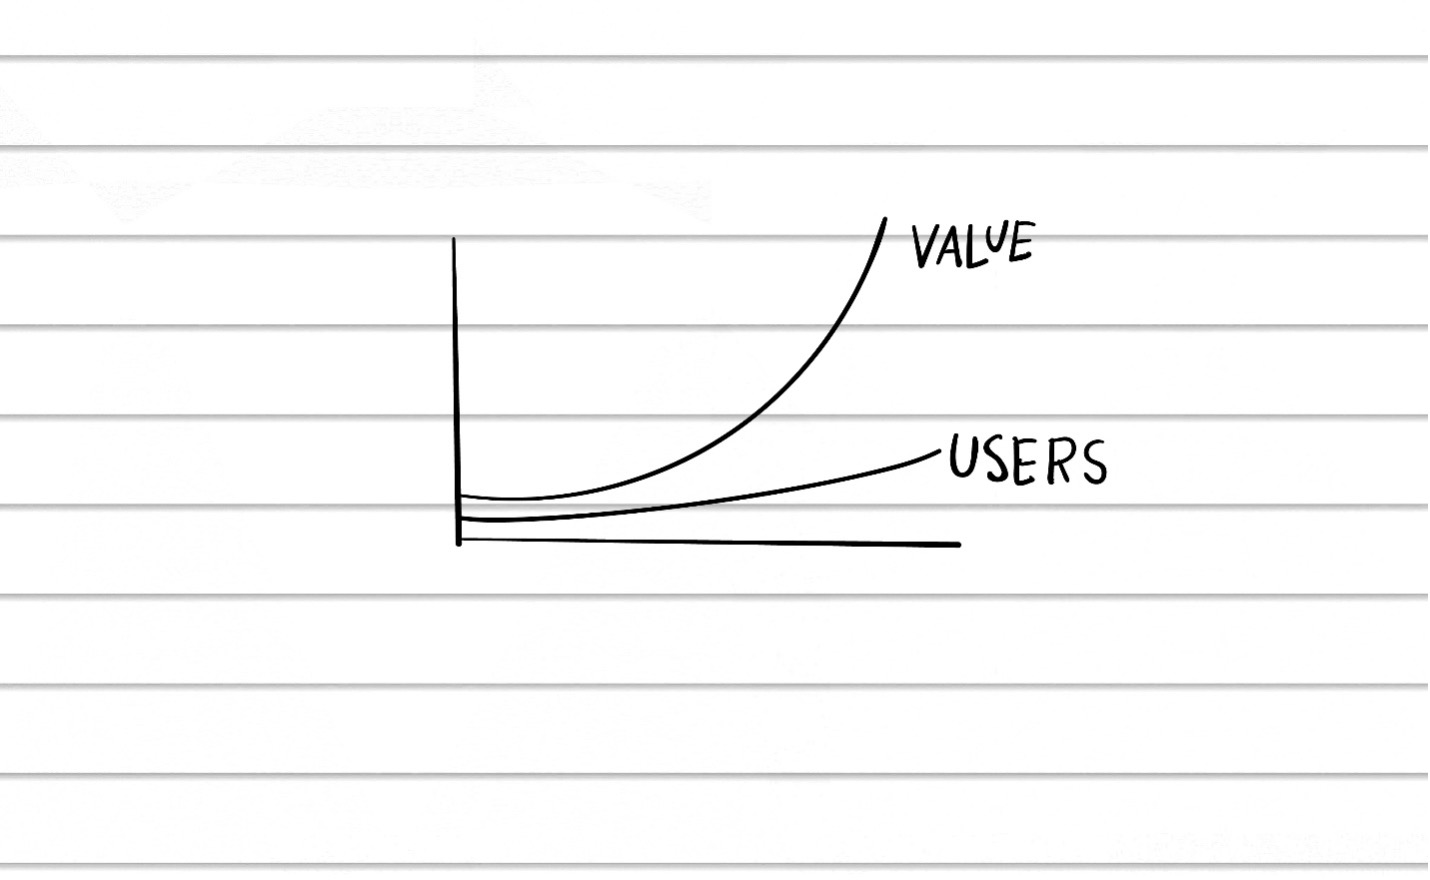
Think of a telephone system: if you have two telephones, you only have one connection. But if you have 5 telephones, you have not 5 connections, but 10. And this number continues to grow quadratically:
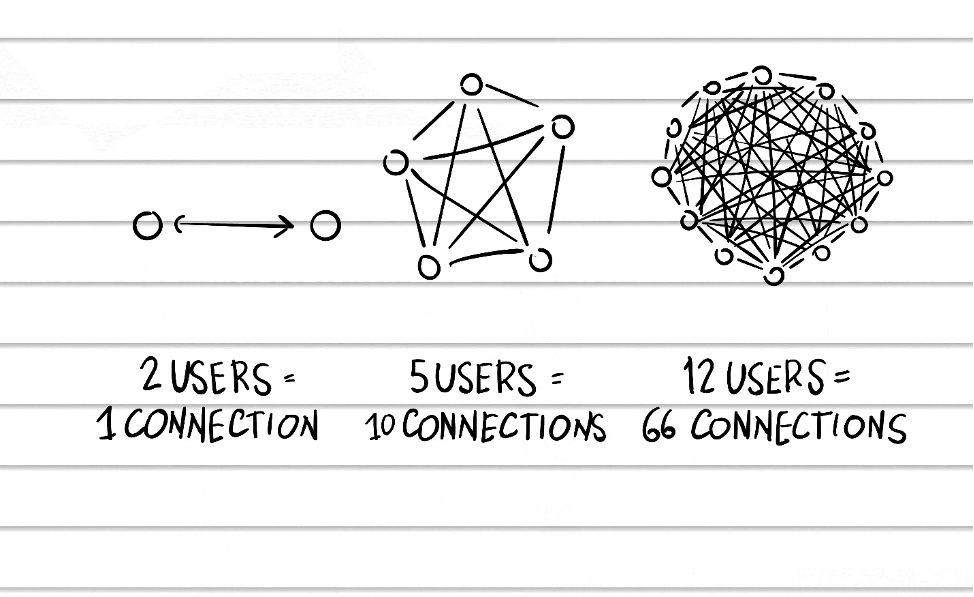
Blockchains have network effects, big-time. As the number of Daily Active Users grows, the value of the network grows quadratically:
Again, very few investors think this way. They look at the price and the market cap, and make a decision. But by looking at users, we can see whether a high price is justified – or whether a low price may be a terrific bargain.
We want to shout it from the rooftops: to value a crypto investment, first look at how many people are using it.
DAU itself won’t tell you much, of course. You’ll need to:
- Compare DAUs against other crypto companies (especially similar companies)
- Analyze whether DAUs are going up or down over the long term
- Factor in any “bull” or “bear” markets which will usually drive DAUs up or down (again, we’re looking for DAUs that look healthy and growing over the long term)
The more you look at DAUs, the more you’ll get a feel for whether a crypto company has real customers, or whether it’s waves of empty users. For the serious investor, DAUs are inDAUspensible.
Note: Token Terminal also lists Weekly Active Users and Monthly Active Users. These work fine – just be sure to use the same metric when comparing investments.
Metric 2: Fees
Fees show if users are willing to pay to use a crypto product.
Every crypto company, just like every traditional company, needs a way to make money.
Typically these come in through “fees.” When you make a transaction on the Ethereum network, for example, you pay “gas fees,” which acts like a service charge that goes back to the Ethereum “company.”
Many cryptos can fake Daily Active Users by giving people free tokens (or teasing free tokens in the future). This is like a company giving away free samples: it only works if you can get enough people to buy the actual product. Eventually, they’ve got to start paying fees.
Fees tell us if a crypto product is good enough for people to pay to use it.
Note: Token Terminal also lists “Revenues” and “Earnings,” and while these numbers are important, they are beyond the scope of this article. For more, see How to Read Crypto Financial Statements.
Here’s a look at Ethereum’s long-term fees:
Ethereum is the gold standard, generating millions of dollars a day in fees.
And here are fees of Binance Chain (BNB):
When fees go up, the product is getting used more often.
While Fees, Revenues, and Earnings will generally mirror Daily Active Users -- you’ll see all of them spike together -- we can use them to ask:
- Is the crypto company making money (as opposed to just giving away free tokens)?
- Do their long-term financial prospects look good?
- Are they keeping any of the profits to re-invest in future growth?
“The beauty of stocks is that they do sell at silly prices from time to time. That’s how Charlie and I have gotten rich.” - Warren Buffett
Metric 3: Market Capitalization (and Price)
Market Cap tells you how much the company is worth, but it is valuable primarily as a comparison tool.
Price and market cap are the only metrics most people use, which is like investing in a restaurant based on the menu price.

Price and market cap are useful to compare the relative size and cost of different crypto companies. A high market cap could indicate a more established company, while a lower market cap could suggest a higher growth potential (but also more risk).
Bitcoin’s market cap is typical: lots of highs and lows, but a long-term upward trend
But if a growing company is off its all-time high, that could indicate a good buy
Price and market cap do not reflect a crypto’s true worth. A high price does not mean a good investment, and a low market cap does not mean a bad one.
Think of it this way: if you went into a used car lot, you’d never buy a car based on the asking price alone. Instead, you’d check the mileage, engine condition, and overall functionality.
Similarly, price and market cap should be used together with DAU and Fees, to help us identify amazing investing opportunities. It all works together.
Putting it Together
Let’s say you hear about a great new project called HypeCoin. All the crypto influencers are talking about it. People are becoming overnight zillionaires. Should you buy?
- First, we look at HypeCoin’s Daily Active Users. We compare them with other, similar projects – as well as established crypto companies like bitcoin and Ethereum. We ask, how long have they been around? Do they have a meaningful track record of DAU growth?
- Next, we look at HypeCoin’s Fees (and possibly Revenues and Earnings). Are they bringing in meaningful money, and is that money growing over time? Or is it all being paid out in token incentives (i.e., free samples)?
- Finally, we compare HypeCoin’s Price and Market Cap against similar projects. We’re not impressed by a high price or a high market cap, we simply ask, Is the high price justified? Is there a “there” there – a real, meaningful business? Or is HypeCoin, indeed, simply hot air?
And remember: quantitative analysis is one side of the coin. We would also run HypeCoin through qualitative analysis, using our Blockchain Investor Scorecard.
Investor Takeaway
Doing quantitative analysis -- looking at the numbers -- provides amazing investing opportunities for those who are willing to take the time, because almost no one does.
This won’t last forever. As more people realize that “cryptos are companies” and “tokens are stocks,” eventually this approach will just become common wisdom, the way things are done.
But for now, it gives us a huge competitive edge. Know the numbers, and you know the truth.
