

To get an idea of which technical indicators financial analysts believe are the most effective for bitcoin trading, we asked a number of them for opinions.
The analysts we queried provide a range of responses. Though they mention many different indicators they use, several respondents emphasize the benefits of keeping technical analysis simple.
The most prominent technical indicators for trading bitcoin include:
- Moving Averages (MA)
- Moving Average Convergence Divergence (MACD)
- Relative Strength Index (RSI)
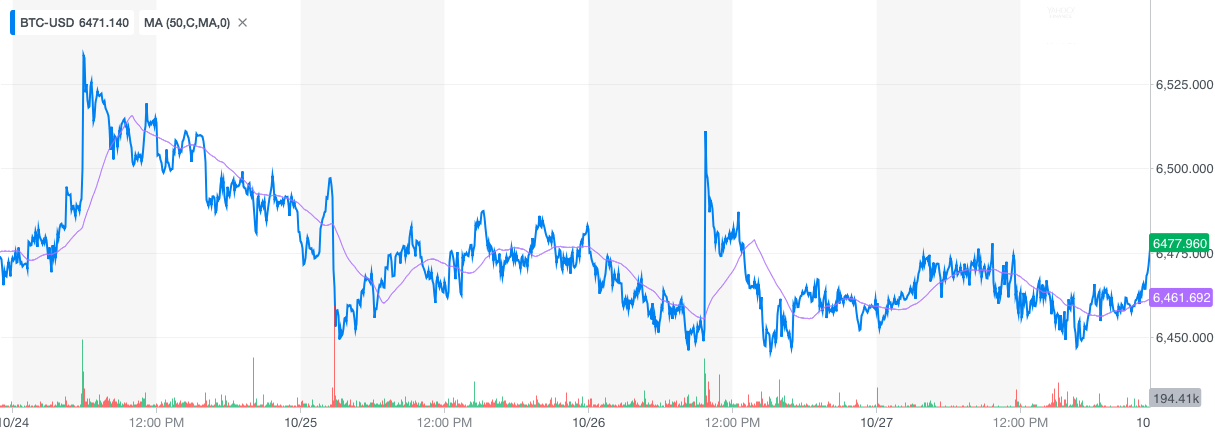
Simple Moving Averages (SMA)
What Are Simple Moving Averages?
A simple, or arithmetic moving average, is computed by adding recent closing prices of an asset and dividing that by the number of time days in the chosen time range.
The idea behind simple moving averages is that they smooth out the volatility of an asset to show the investor the asset’s current trend. Moving averages can be short-term or long-term.
Short-term moving averages respond quickly to changes in the price of the asset. Long-term averages are much slower to react and are, thus, used to show the long-term trend of the asset.
How to Use SMAs to Trade Bitcoin
Joe Lee, co-founder of Magnr, emphasizes the value of these indicators, saying:
“My [favorite] technical indicators were always moving averages. A moving average takes short-term volatility out of the equation such that you are not trading against pure speculators.”
By leveraging these averages, you can help identify price trends and use those trends to turn a profit. For example, by calculating bitcoin’s five-day simple moving average (SMA), which is just the digital currency’s average price during that period, you can then compare that figure with bitcoin’s 10-day SMA in order to evaluate potential trends.
Should the digital currency’s five-day SMA, for example, surpass (or crossover) its 10-day SMA, this development points to bullish momentum in the market. In other words, this kind of crossover would show that bitcoin’s price is rising.
If this trend continues, you could potentially generate compelling returns by buying in. However, bitcoin markets are volatile, and it can be quite helpful to have confirmation that the trend is indeed bullish before you purchase the digital currency.
Longer-Term Moving Averages
A great way to confirm a bullish trend in a situation like this is to wait and see whether there is a longer-term crossover. If the 10-day SMA also exceeds the 20-day SMA, this crossover helps provide additional confirmation that the market’s momentum is bullish.
To put it simply, having a second, longer-term crossover like this helps reaffirm that price is rising, notes Charles Hayter, co-founder and CEO of digital currency platform CryptoCompare. Taken together, the two crossovers represent a stronger indicator of bullish momentum.
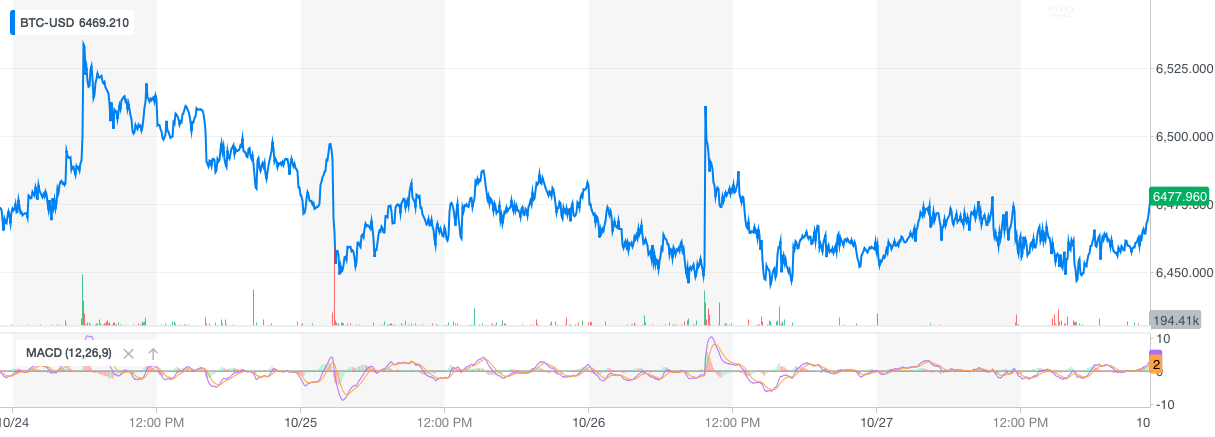
Moving Average Convergence Divergence (MACD)
What Is the Moving Average Convergence Divergence?
The Moving Average Convergence Divergence indicator, commonly referred to as MACD, is one of the most popular technical indicators for stock and currency traders alike.
The MACD is a momentum oscillator that incorporates multiple moving averages to identify bullish and bearish trends.
Making use of this technical indicator requires first calculating the Exponential Moving Average (EMA), which is similar to the SMA but gives greater weight to the most recent price data. Making this adjustment helps to reduce the lag associated with relying on moving averages.
For example, calculating bitcoin’s 12-day EMA would involve gathering price data for all sessions during that timeframe and then determining how much weight the final day’s price information should have relative to those of the other sessions.
To determine bitcoin’s MACD, you could use the aforementioned methodology to calculate the digital currency’s 26-day EMA and then subtract that from its 12-day EMA. (Trading software can do this for you as well.)
How to Use the MACD to Trade Bitcoin
The MACD can provide users with several different buy (or sell) signals. For example, when the MACD line passes through the signal line from the bottom upward, this could be a buy signal.
Additionally, if the price of an asset is falling but the MACD line is rising, this may be the sign of a trend reversal.
Conversely, if the MACD rises very quickly, this may be a sign that the asset is overbought and will soon revert to lower levels.
The MACD provides a wide range of insight into the price movements of an asset and is, therefore, a regular feature of chart analysis by experienced bitcoin traders.
Relative Strength Index (RSI)
What Is the RSI?
The Relative Strength Index, also known as RSI, is a popular indicator to gauge the momentum of an asset. The RSI measures the speed and change of price movements to discover whether an asset is currently overbought or oversold.
How to Use the RSI to Trade Bitcoin
By identifying when bitcoin is overbought, you can pinpoint opportunities to take profits and avoid overpaying for the digital currency.
Figuring out when bitcoin is underbought, on the other hand, can provide appealing opportunities to purchase the currency. By singling out these opportunities, you can potentially generate compelling returns.
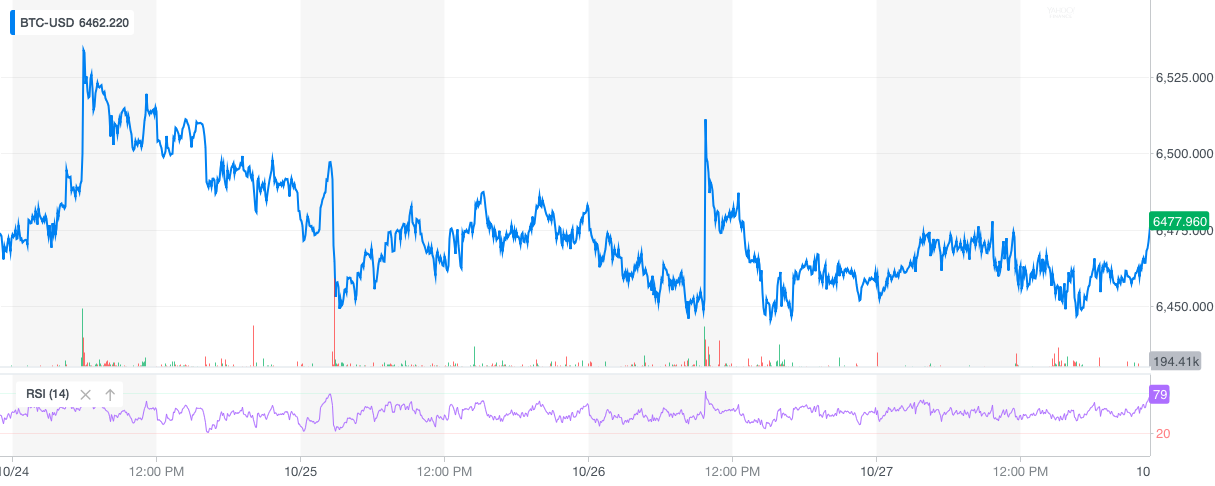
When looking at the RSI graph, when the oscillator line crosses the 70 mark, bitcoin is considered overbought and when the line crosses below the 30 mark, the digital currency is considered to be oversold.
Some traders prefer to use the 80 and 20 marks on the RSI, to receive stronger overbought and oversold signals.
The RSI is often used in conjunction with the MACD or simple moving averages.
Lagging Indicators
Certain technical indicators (for example the MACD and RSI) are lagging indicators, meaning that they trail the price of an asset like bitcoin. Because these indicators follow the price of the security being studied, they may not provide the information you need to make a successful trade until a trend has ended.
Price Is Paramount
As a result, some traders believe that price is the best indicator. Petar Zivkovski, COO of leveraged digital currency trading platform Whaleclub, is in this particular camp. He observes:
“I’ve found after years of trading [manually] that the best indicator is price itself.”
Zivkovski emphasizes that lagging indicators do not always provide the same value. He says:
“Technical indicators such as MACD and RSI are functions of price, so they are delayed relative to price by definition. So any information you get from them will be slower than what you can get from price itself.”
Market Sentiment
To use technical analysis effectively, you must understand trader psychology and the impact it has on the securities markets. Assets, such as stocks and bonds, always follow cycles that include booms and busts.
In this particular case, Zivkovski asserts that technical analysis is effective because many traders are using it. He notes:
“Technical analysis is a psychological tool and works because other traders use it too … The simpler the tools you use, the more players in the market are using those too, and the more likely they are to succeed.”
Best Resources for Bitcoin Technical Analysis
Excellent platforms that offer technical analysis tools for digital currency traders for free include:
A Great Tool But One of Many in Your Arsenal
Technical indicators are an excellent tool for traders when it comes to identifying trends, determining possible entry and exit positions, and getting an idea of where the market may head next.
However, technical analysis should be only one tool in your arsenal of knowledge and skills for investing in bitcoin and other digital currencies.
Staying on top of market-moving news, keeping an eye on changes in trading volumes, and having a strong view on the specific digital assets that you are trading are all important aspects of trading and investing in bitcoin.
Related Articles:
- How to Buy Bitcoin on Coinbase, Step by Step (With Photos)
- Bitcoin vs. Bitcoin Futures: Which is the Smarter Investment?
- Bitcoin Regulations by Country (Updated for 2018)
If you want to learn more about investing in bitcoin and other digital currencies, subscribe to the Bitcoin Market Journal newsletter today and join thousands of like-minded investors.
