
Chart analysis is an excellent tool to help you make trading decisions. Here, we discuss how you can use the Moving Average Convergence Divergence (MACD) indicator to assist you in your bitcoin trading decisions.
What Is the MACD?
The Moving Average Convergence Divergence (MACD) is a momentum oscillator that uses multiple moving averages (MAs) to identify bullish and bearish trends. The MACD is one of the most popular technical indicators for equity, forex, and digital asset markets as it combines a number of factors into one indicator.
How to Use the MACD
The MACD can provide a number of different trading signals that you can use to help your trading decisions.
For example, if the MACD line passes through the signal line from the bottom upward, this would be considered a buy signal. Alternatively, if the MACD line passes through the signal line from the top down, it would be considered a sell signal.
In the chart below, the MACD line is the blue line and the pink line is the signal line. You can see that on June 15, when the MACD passed through the signal line from the bottom upward, the buy signal was correct as the price of bitcoin subsequently rallied for a number of days.
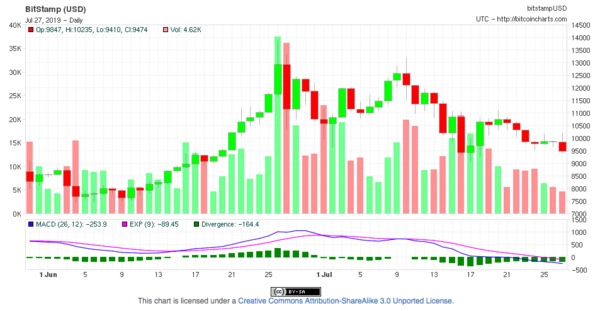
Another trade signal occurs when the MACD line has risen fast, which may suggest that the asset is overbought and a trend reversal could occur soon. This can be witnessed on the chart above at the end of June when the MACD line indicates overbought levels and the market subsequently corrected.
Alternatively, when the MACD and the signal line diverge substantially, that may be another sign of a trend reversal. Looking at the chart above, you can see that when there was a big divergence on June 26, the trend reversed and the price of bitcoin corrected.
Best Combined With Other Indicators
While the MACD can be a great tool to help you identify entry and exit levels for your positions, it is best not to base trading decisions purely on MACD buy and sell signals. Technical indicators, such as the MACD, provide trade signals based on past price data, which means they can suggest trends but are by no means crystal balls that can accurately predict where the price will go next.
If you want to use the MACD to trade bitcoin, it is best to combine it with other technical indicators such as the Relative Strength Index (RSI), Simple Moving Averages, and volume indicators to receive stronger buy and sell signals. For example, if you choose four technical indicators and they all show a buy signal, you could execute a trade. However, if only two of the indicators show a buy signal, it may be too weak and not worth trading.
Related Articles:
- Top Tools for Bitcoin and Altcoin Investing
- What Are Cryptocurrency Trading Bots and Should You Use Them?
- Best Bitcoin and Cryptocurrency Exchanges for 2019
Subscribe to the Bitcoin Market Journal newsletter to learn more about how to invest in bitcoin, altcoins, and blockchain technology.
