

Are you one of the thousands of bitcoin traders looking for the ‘perfect’ technical indicator? Your search will never end, for there are no ‘guaranteed-gains’ indicators…anywhere.
However, if you’re willing to spend a little time learning how to use the Relative Strength Index (RSI), you may find yourself in accord with the untold number of traders who agree that RSI is the ‘must-have’ indicator.
Meet the Relative Strength Index
Here’s a brief excerpt of investopedia.com’s definition of the RSI:
“The relative strength index (RSI) is a momentum indicator that measures the magnitude of recent price changes to evaluate overbought or oversold conditions in the price of a stock or other asset.”
The words momentum, overbought (OB) and oversold (OS) are indeed important descriptors of the RSI action on your charts. However, did you also know that the RSI is a superb trend bias indicator?
Here, we will show you three ways to view bitcoin’s trend, momentum, and OB/OS price action in a cohesive context that can help keep you miles ahead of uneducated traders.
We’ll use the 14-period RSI setting that is standard in most charting platforms. Later, we’ll examine an effective way to use a 2-period RSI to help pinpoint low-risk trade entries.
RSI: Trend Bias and Support/Resistance
Study enough technical price charts, and you’ll likely see a repeating pattern in the RSI (14):
- Sustained RSI (14) readings of 50 and higher typically coincide with bullish bitcoin trends.
- Sustained RSI (14) readings of 49.99 and below typically coincide with bearish bitcoin trends.
- Once in either of those defined trend biases, pullbacks toward an RSI (14) reading of 50 often act as a significant support or resistance level.
Here are two recent examples of this technical setup at work in BTCUSD:
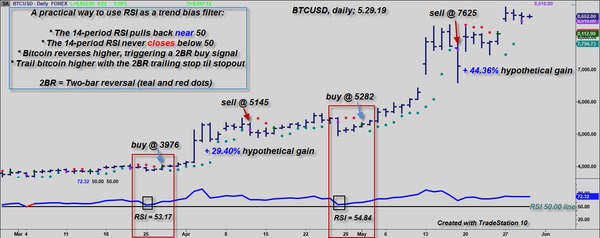
Anytime a sustained bullish RSI (14) trend dips close to 50, with bitcoin subsequently rallying, a low-risk buy op is possible. In these hypothetical examples, a simple two-bar reversal entry trigger signaled two buys that went on to make substantial gains. (Chart graphic: TradeStation 10)
Using a simple two-bar reversal entry trigger (buy the highest high of the previous two price bars, plus a tick) proved to be an effective, low-risk trade entry signal in both of the above examples. You could also use slightly faster trade entry indicators such as CCI, Stochastics or a 2-period RSI, perhaps boosting the potential gains.
Begin viewing your bitcoin charts via your trusty RSI (14) and you’ll be blessed with a very accurate trend bias indicator. Taking entry signals in the direction of that trend may help boost your winning percentage and your bottom line.
(For more investing news and tips, subscribe to the Bitcoin Market Journal newsletter today!)
RSI Price/Momentum Divergences
Trading price/momentum divergences is a form of counter-trend trading. As such, it’s a bit riskier than trading in the direction of the major trend. However, this style of bitcoin trading can still provide winning trade setups.
Here’s what to look for when sizing up a chart for a price/momentum divergence op:
- Look for bitcoin to make a strong surge that brings the RSI (14) above the 70 level (higher is better).
- Watch for a subsequent bitcoin swing that closes higher than its previous swing.
- The RSI (14) reading of the second upswing must be lower than that of the first swing.
Once all of that is in place, you now have a valid price/momentum divergence setup (bearish). All that’s needed is a short entry trigger. An effective entry trigger can be shorting the lowest low of the previous two bars, also known as a two-bar reversal.
Here are three recent examples of bearish bitcoin price/momentum divergence setups:

All three of the recent bearish price/momentum trade setups in bitcoin were profitable. Counter-trend trading is riskier than trading in the direction of the trend, but for skilled bitcoin traders, this aggressive approach to market timing might make consistent money. (Chart graphic: TradeStation 10)
RSI: OB/OS Oscillator with the Trend
It’s always fun to create a trading strategy – for free! Your bitcoin trading platform almost certainly has RSI and Price Channel (aka Donchian Channels) indicators as standard equipment. Put them to work for you.
Set your RSI lookback to 2 and your Price Channel lookback to 10. Your RSI is now a fast overbought/oversold (OB/OS) oscillator, and your 10-period lower price channel is helping you identify the medium-to-long term trend. Presto – you’ve got a workable ‘buy the pullbacks’ bitcoin and altcoin trading template with which to work.
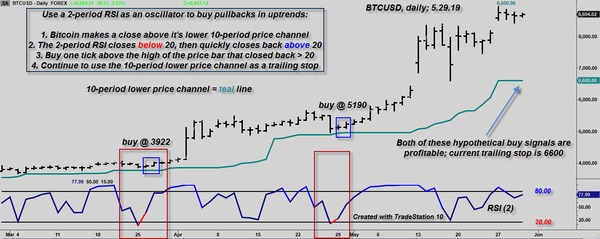
$5,000 for a trading system? Say what? Why not just plot a 2-period RSI and a 10-period lower Price Channel on your bitcoin charts instead! Not every trade will be a winner, but you’ll always be trading in the direction of the trend, putting the probabilities of success in your favor. (Chart graphic: TradeStation 10)
Traders in a variety of financial markets have been using ‘buy the pullback’ systems similar to this for a very long time. You can use just about any trend ID indicator (ADX, DMI, ParaSar, Aroon, long-term moving averages, etc.) in place of the 10-period price channel shown above. These indicators may also help you achieve decent long-term trading results with this pullback trade entry style. Check it out!
What Is the Best Bitcoin Technical Indicator?
Bitcoin traders may differ on which technical indicator is ‘best.’ However, it’s hard to argue against the RSI’s utter simplicity and versatility, not to mention its ability to help ID winning bitcoin trade setups.
Which RSI Setup Is Best for Me?
This depends on your trading experience and financial goals. If you are patient and can stay with a long-term trend, then, by all means, try using the Trend Bias and Support/Resistance or the OB/OS Oscillator with the Trend methods fleshed out above.
Conversely, if you prefer short-term trade action and adrenaline rushes, then trading the Price/Momentum Divergences template might be right up your alley. Gains (and losses) tend to arrive much more quickly when trading in this counter-trend fashion. At times, this trading style leads to sizable gains, especially if a major bitcoin uptrend is on the verge of a big-time bearish reversal. However, you must be quick to cut losing trades short, before they get out of hand.
Testing, Testing, 1-2-3
Try recreating each of the three RSI-based templates in your own bitcoin trading platform today. Consider paper-trading the models that you find most appealing, and when you feel confident to trade them with real money, be sure to limit your per-trade account risk to around one percent. Limiting your financial risk helps ensure you’ll be around for the various bitcoin bull and bear markets to come in the years ahead.
Got questions about bitcoin investing strategies and other activities in the bitcoin universe? Contact us today!
Author disclosure:
The author has no open positions in bitcoin or any other coin at the time of this writing.
All trading examples and/or systems were constructed with the tools included standard in TradeStation 10. All trade examples and system results are hypothetical and are not specific trading/investing advice for any specific person or entity.
