
If you look for statistics on bitcoin trading volume by country, you may be surprised to learn that there is no 100 percent reliable and accurate data available in this regard.
There is a reason why that is the case. It is next to impossible to consider all the variables that would make up such a body of data. Over the years, people have attempted to compile statistics that would approximate the actual trading volumes. These efforts have mostly fallen flat, however.
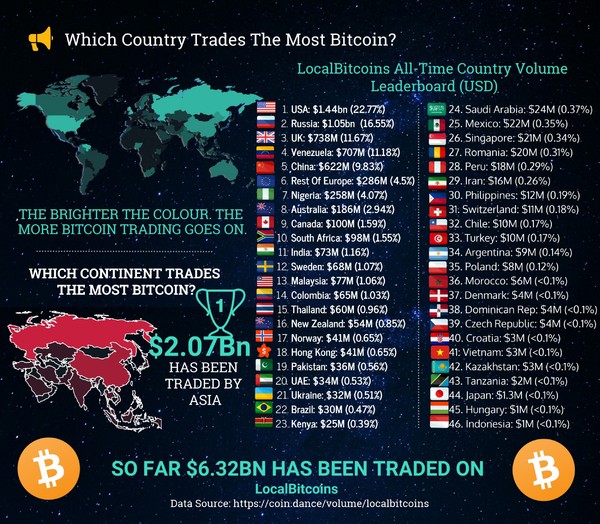
An example is an oft-cited report based on LocalBitcoins volume data, published in August 2018.
Our BMJ team has managed to locate the raw data used for the mentioned report. Even at a quick glance, it raises questions rather than provides answers.
Looking past the fact that most of it is outdated, you can’t help but wonder:
- How can Russia be second, after the US?
- Where are Japan and South Korea, both well-known hotspots of bitcoin trading?
- China used to be considered the source of 90 percent of global bitcoin trading volumes before authorities banned trading/exchanges there. Why is it listed behind Venezuela?
- Are these statistics relevant at all outside the confines of Localbitcoins? The answer is a definite “No.”
The Localbitcoins report does not consider OTC trading outside of the Localbitcoins ecosystem. Indeed, it may be downright impossible to gain statistical information on all OTC trading.
Exchanges Are the Statistician’s Best Bet
While exchanges themselves are the statistician’s best source, they do not seem really keen on publishing much country-specific information.
Still, savvy statisticians have drawn relevant conclusions from the amount of various fiat national currencies used to transact bitcoin, on a 24-hour basis.
This approach has its own flaws, of course.
- It is entirely exchange-based, ignoring OTC information.
- It only considers fiat-to-bitcoin and bitcoin-to-fiat transactions.
- Due to the fact that exchanges are banned in China, the country is not present in these statistics. Its actual bitcoin trading volumes are a mystery these days. It is, however, safe to assume that China should be among the top entries on this list.
Even so, these statistics offer a much better snapshot of the country-by-country trading volumes than the Localbitcoin charts.
The USD is unsurprisingly at the top, with 303,355 BTC bought/sold for USD daily. This makes up 65.33 percent of the total bitcoin trading volume exchanged for national currencies.
The Japanese Yen is second, with 95,229 BTC bought/sold for JPY per day. Japan is thus responsible for 20.51 percent of the global fiat/BTC trading volume.
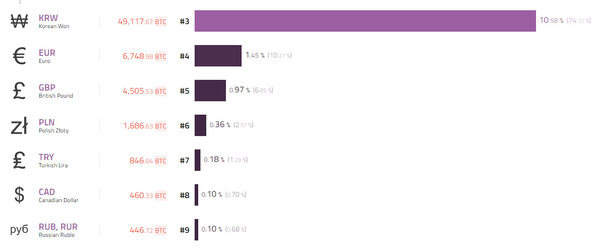
Even at a glance, the graph makes more common sense than the mentioned Localbitcoins report. It may not do justice to countries which are heavy OTC traders, such as Venezuela and Russia, but it does offer a ballpark approximation of the real situation.
The graph is based on data drawn from some 222 digital asset exchanges.
Take Bitcoin Trading Volume Statistics with a Grain of Salt
We may look past trading volume data manipulation, but nailing down accurate information in this regard is still almost impossible. The variables involved are too many and too nuanced. The best you can do is to try to glean relevant exchange data and tweak it based on available OTC trading information.
Subscribe to the Bitcoin Market Journal newsletter for accurate and relevant insights on investing-related aspects of the digital currency industry.
