

In the blockchain industry, new investment opportunities pop up with impressive frequency. It is therefore important to find reliable means of evaluating such opportunities.
What gives a blockchain project true value? What factors drive digital asset price movements? How do you know if bitcoin is fairly valued right now?
Several mathematical models exist to answer those questions and more. Some of these digital asset valuation metrics have already been covered by the BMJ team.
Quantitative valuation metrics should be preferred to qualitative ones. They are, after all, inherently objective.
Some of these quantitative metrics correlate the age of coins being moved with factors like investor sentiment, demand, etc.
Here, we take a closer look at several other metrics that may be helpful to investors. We’ll explain:
- HODL Waves
- BDD
- VOCD
- HODL Bank
- Reserve Risk
- Realized Capitalization
- Unrealized Profit/Loss
- MVRV
- Liveliness
- Delta Capitalization
- Bitcoin Network Momentum
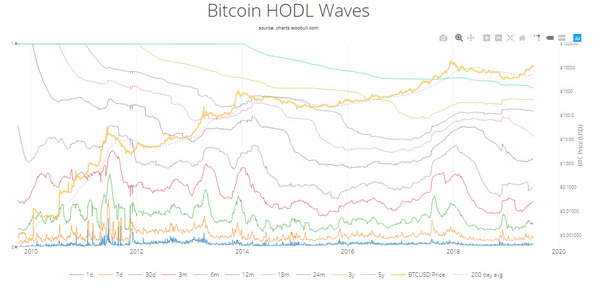
HODL Waves offer a relevant snapshot of the age-makeup of a UTXO set
UTXO is the unspent transaction output, which can be used as the input of a new transaction. It is, in effect, the amount of unspent bitcoin you own. A UTXO set is the total unspent value of a network like BTC.
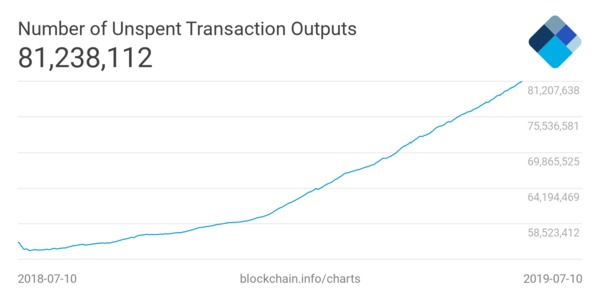
The older a UTXO set is, the more HODLers there are. More people holding a coin translates to more confidence in its future.
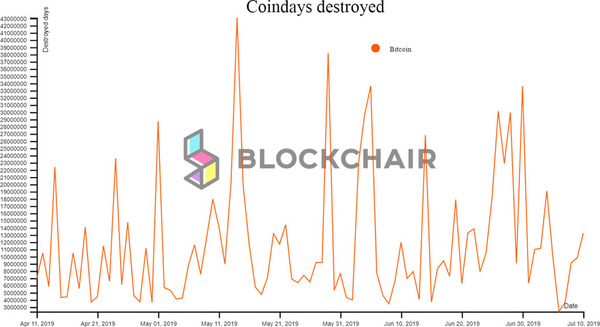
Bitcoin Days Destroyed (BDD) measures how much bitcoin long-term holders sell/move over time
To understand how this metric works, you need to know what Bitcoin Days are.
If you hold 1 bitcoin for 1 day, you will generate a Bitcoin Day. If you move that bitcoin after 3 days, to pay for services or to sell it, you will destroy your resulting 3 Bitcoin Days. When long-term holders begin moving their bitcoins, BDD spikes. When they HODL, it drops.
Why do people hold their coins? Most likely because they see value in them or in the network and hope they will be worth more in the future.
Adjusted BDD divides the daily BDD by the circulating supply of bitcoin. This way, it compensates for the inevitable accumulation of BDD over time.
Value of Coin Days Destroyed (VOCD) introduces a USD reference to the BDD equation
Its value is the sum of Adjusted BDD multiplied by the daily price of bitcoin. VOCD expresses the “opportunity cost” paid by holders, who refuse to sell their bitcoin for X amount of USD today.
Those who do so obviously believe the true value of their coins exceeds what the market is willing to pay for them right now.
The HODL Bank is the cumulative amount of this “opportunity cost” over time
The larger it is, the more confidence BTC holders have in the future of the network or coin.
The Reserve Risk describes whether bitcoin is currently over/under/fairly valued
It accomplishes that by dividing the current bitcoin price by the HODL Bank. If the confidence expressed by the HODL Bank is large and the price is low, the resulting ratio means that bitcoin is an attractive investment. If the price is high and the confidence low, the investment is not an attractive one.
A low Reserve Risk means a buy opportunity. High Reserve Risk means the asset is not attractive from an investment perspective.
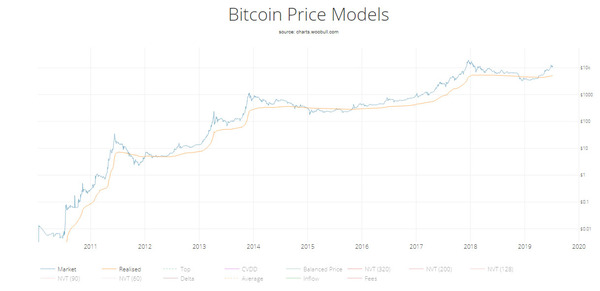
Realized Capitalization attempts to establish the “real” market cap of a UTXO chain (like bitcoin)
Several different versions of it exist. Its primary goal is to eliminate lost coins from the market cap, thus delivering a more accurate snapshot of a project’s true value.
The Realized Cap model is not an accurate one. It is more of an approximation of what a chain’s true capitalization is. One version of the model counts all coins at the value at which they were created. Another one counts the value a coin had the last time its owner moved it.
Unrealized Profit/Loss is the result of the subtraction of Realized Cap from the total Market Cap
To turn this variable into an investor sentiment indicator, valuation specialists have divided it by the total Market Cap. Thus, the Relative Unrealized Profit/Loss was born.
A high Unrealized Profit/Loss ratio indicates investor greed. A low ratio is the hallmark of investor caution.
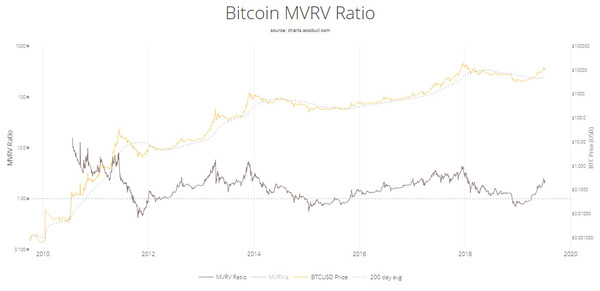
Market Value to Realized Value (MVRV) Ratio
Traders use the MVRV as a technical indicator to pinpoint accumulation and distribution stages. It also provides a snapshot of the perpetual tug-of-war between HODLers and speculators. The ratio results from the division of the total Market Value of a coin with its Realized value, on a daily basis.
Lower MVRV ratios show asset undervaluation. Higher scores may point to asset overvaluation due to hype-based exuberance.
Liveliness is a measure of saving behavior on a blockchain
According to its best definition, it is the ratio resulting from the division of the sum of all BDD by the sum of all Bitcoin Days Ever Created.
Liveliness is range-bound, between 0 and 1. A ratio of 1 would indicate that all coins moved within one block. A 0 indicates no transactions other than issuance.
A higher liveliness ratio indicates a vivid network. A low ratio points to a lack of transactions. As far as saving behavior goes, low liveliness scores indicate an appetite for HODLing. High scores point to strife and selloff, or possible accumulation.
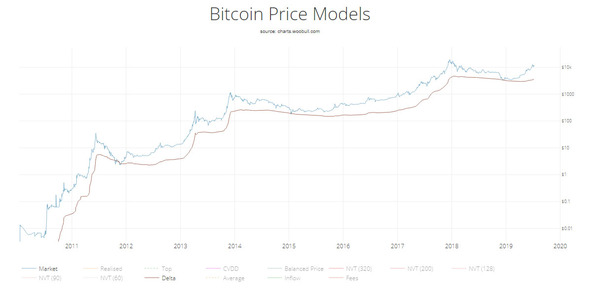
Delta Capitalization introduces another metric to the valuation equation: Average Capitalization
Average Capitalization is a long-term moving average, aiming to keep track of the entire history of the asset’s market cap.
Delta Capitalization is the Average cap subtracted from the Realized Cap. Technical analysis uses the resulting Delta Cap moving average to try to pinpoint bear market bottoms.
Bitcoin Network Momentum indicates the health of the network
It shows the relationship between the asset price and the daily bitcoin transaction value. This relationship also provides relevant conclusions on the speculator versus HODLer balance.
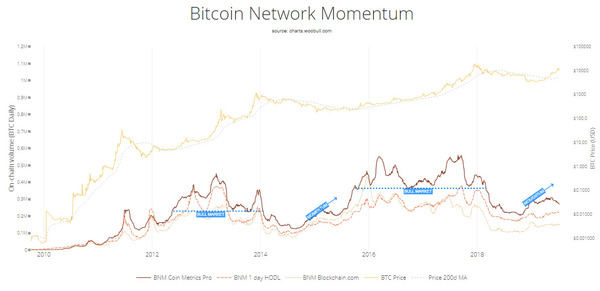
The metric works best when used in combination with another method, such as the MVRV. Network momentum explains why the MVRV shows what it does.
Remember that none of the discussed digital asset valuation methods offer a magic bullet-like solution. Scores of “custom” valuation methods exist, as proven by this post by Vitalik Buterin. Different assets call for different valuation methods.
This is not a comprehensive list of blockchain valuation methods and metrics. New models appear all the time. Contact us if you want to see your preferred method listed here.
Subscribe to the Bitcoin Market Journal newsletter for a closer look at digital asset investment opportunities.
