

This morning before the bell, the U.S. reported their best quarterly figure for gross domestic product (GDP) growth in history.
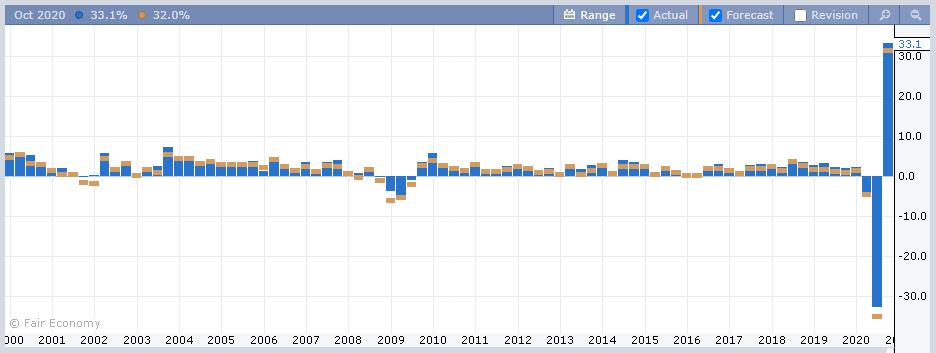
Well, it was the best increase in percentage terms, anyway. Indeed, the economy has seen quite a recovery from the depths of the downturn in April and May, but we’re really nowhere near anything resembling normal.
On this graph, it’s rather clear to see how even though the third-quarter figures surpassed expectations, they were largely a reversal of the damage sustained during the previous quarter.
As one popular analyst put it on Twitter:
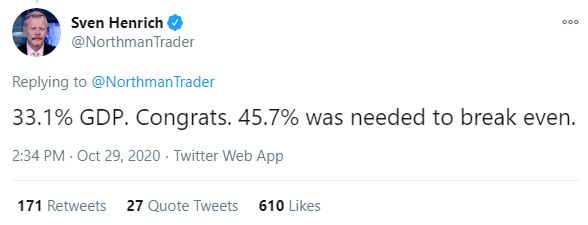
Method to the madness
Nevertheless, for those who like to trade on momentum and irrational exuberance, the record-breaking headline friendly figure was more than enough to soothe nerves this morning, including those of President Donald Trump.
All in all, the selling action did cause a lot of drama (including from yours truly), but as Bloomberg’s John Authers put it in his latest daily note, this is nothing more than profit taking in the face of uncertainty and big risk events.
The decorated analyst pointed out that the main subjects of the sell-off were assets that have seen accelerated profits lately, including bitcoin.
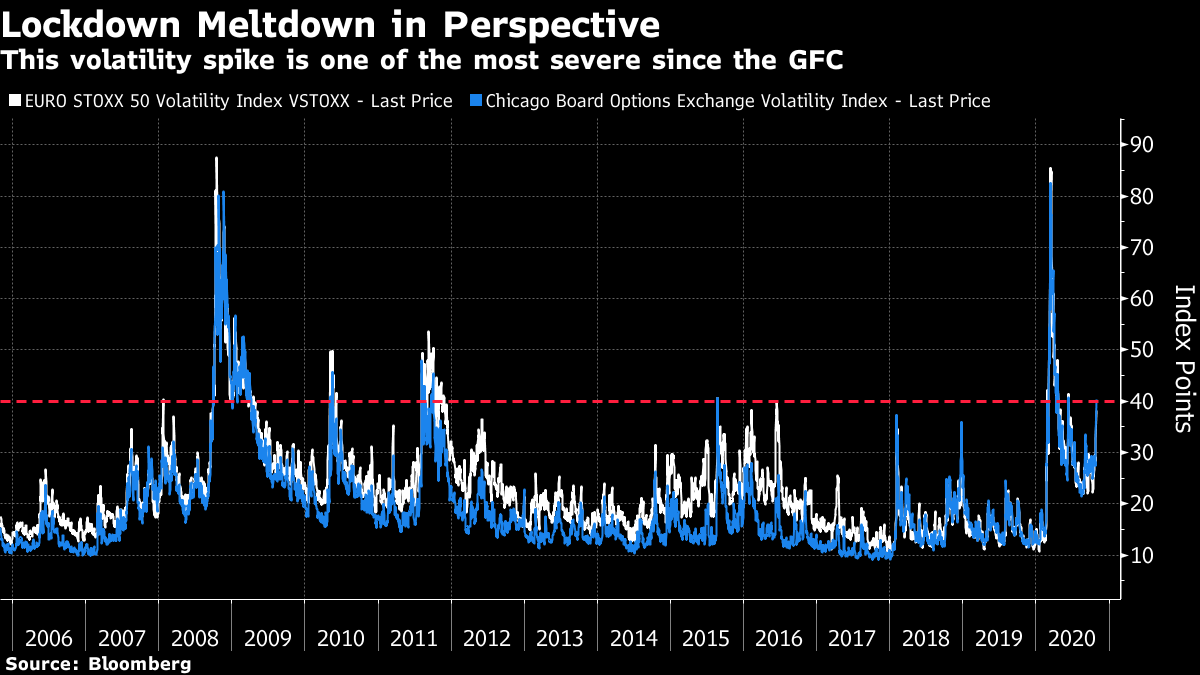
Putting the volatility into historic perspective, Authers notes that while the VIX surpassed 40 on Wednesday, Oct. 28, it more than doubled that figure in March.
Further, volatility has only been higher than it is now a handful of times this decade. So yeah, these are pretty tense times.
Still, it’s worth pointing out that despite the headlines and the extreme volatility, U.S. stock indices are still only down about 10% from their all-time highs, and some investors might consider that a bargain.
However, even for those in a buying mood, it may pay to wait a few hours. After the closing bell today, we’ll get the earnings reports from Apple, Amazon, Google, and Facebook.
Collectively, they make up a significant chunk (forgive me for not doing the math) of the total value of all markets in the world right now.
Double resistance
Bitcoin continues to test the key resistance level of $14,000 (dotted red line) today, as well as the upper end of it’s upward facing channel (yellow lines), which can be clearly observed on the daily chart.
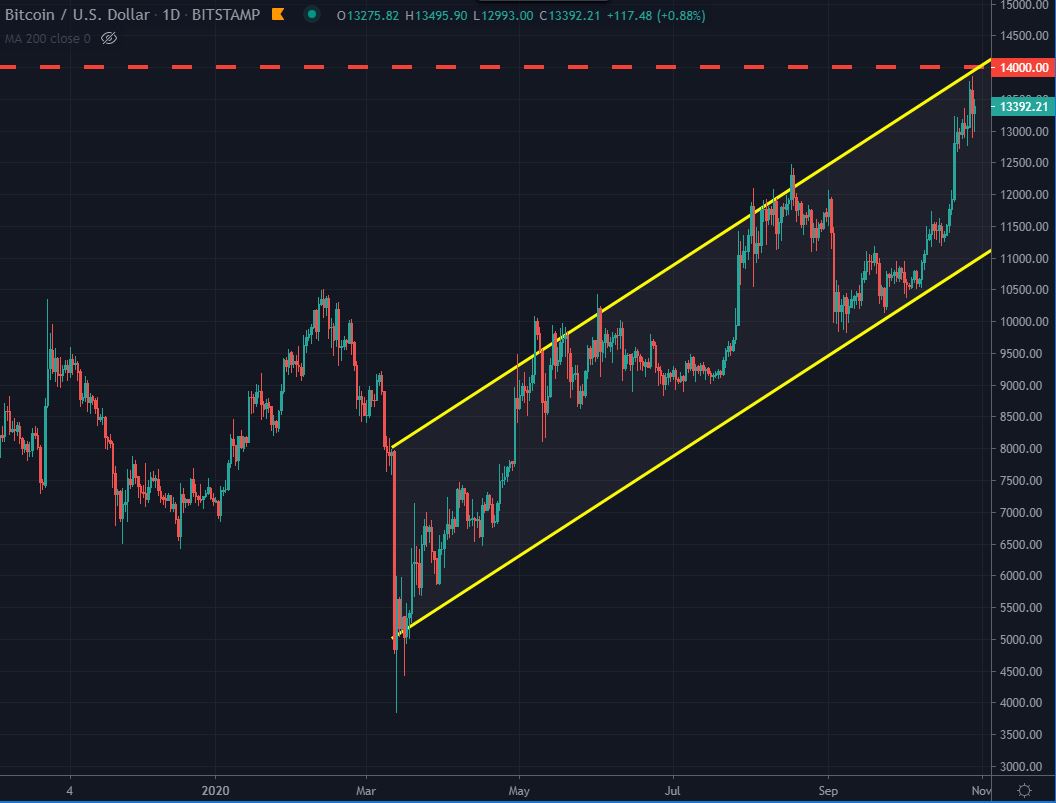
We’ve touched on this a few times already, but it may have been a bit confused by my own personal forward-looking blather.
So, to be clear, in a setup like this, with two strong resistance points (the top yellow line and dotted red) converging, the most likely outcome would be a sizable pullback.
If this does play out in a textbook fashion, we can expect the bottom yellow line to be reached once more before we get a second test of the $14,000 level.
However, I think most can agree that the current environment in global markets is anything but textbook.
There have been a few times in my career where we’ve observed a strong, upward breakout of an upward-facing channel.
Usually, this only happens during periods when fundamental factors are extreme, which does seem to be the case now. So, this could really go either way.
For long term hodlers, it matters not. For short-term, high-risk traders, good luck!
