

Problem is, not enough people know how to do the work, or what the work even looks like, especially in the emerging digital asset market. There are so many new projects doing so many different things, and unlike traditional markets, there aren’t any standard ways of evaluating them.
As a result, we at BitcoinMarketJournal.com have released the world’s most comprehensive model for comparing blockchain projects. This is truly groundbreaking work!!!
When we first started working together several months ago, I recall John Hargrave giving me a sneak peak of what they were doing, and now that it’s complete, I just can’t get over how easy it is to understand and to use. In just five minutes, anyone can now present their favorite project in an unbiased way to other prospective investors.
The overview along with a simple explanation can be found at this link .
The analysts have also filled out the model for the top 50 digital assets, which can be found in the table at that same link.
The model is separated in to two parts, qualitative and quantitative, and of course it’s explained on the page. I’ve filled out both just now for the Chiliz project, for which I’ve recently signed on as an advisor. For the qualitative section, they received an average score of 4.4. You can see my scorecard here.
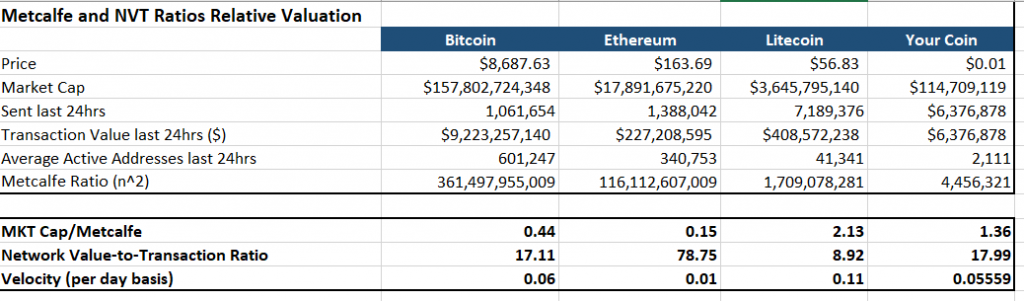
For the quantitative analysis, which is less subjective, they actually received scores that stack up relatively well against some of the largest cryptoassets in all three of the main categories.
For those of you who are interested, I’d love to hear how your favorite projects measure up using this method. So please feel free to send them in as a reply to this message or on social media.
Inflate it
Markets have been pretty flat in the Asian and European sessions today. The narratives are quite drastic, but it does seem like they’ve been playing out long enough for investors to take their respective positions.
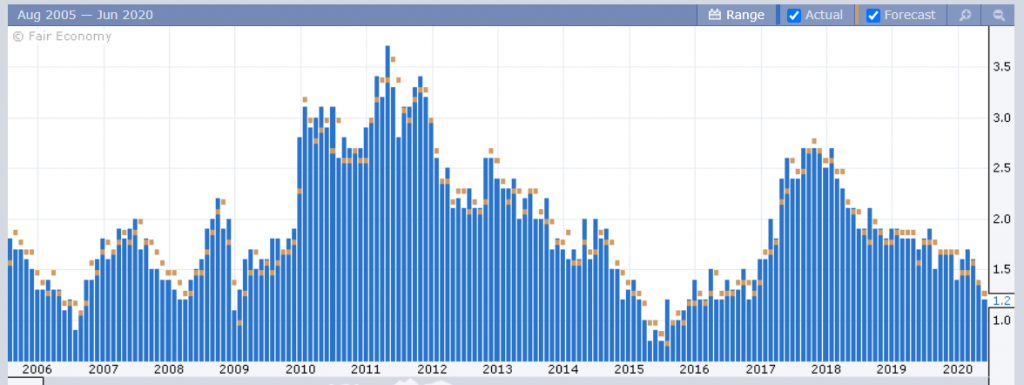
Today, we’re seeing inflation data in focus in the U.K., Europe, and Canada. One might think that with all the new money in the system, we would see an uptick in inflation, but actually we’re seeing a lot less inflation due to subdued spending.
In the U.K., for example, we can see that the Core CPI inflation gauge has come out at it’s lowest levels since the era of the Brexit referendum in mid-2016, as lockdown measures persist.
So, for as long as the economy remains in this docile state, we can probably expect inflation to continue diminishing. As far as markets go, I guess we’ll need to wait for some sort of new narrative to decide the direction. Or vice versa.
Bitcoin inflation
Speaking of inflation, I wanted to bring up another topic that’s been bugging me lately. Well, actually it’s something that was bugging QE analyst Jason Deane, but now that he’s written about it, it’s bugging me too.
Not that it’s necessarily wrong to say that bitcoin is deflationary, it’s just not correct. There’s actually a better word to describe bitcoin’s tokenomics. Rather than inserting any spoilers though, I’ll just let you read the post. Hopefully, we can all adjust our vernacular accordingly … disinflationary. Dang it!
