
With all the fun on Twitter lately with Elon Musk and the Dogecoin maximalists, it’s easy to get swept up in it.
Though in my mind, the real news comes from global investment bank Jefferies, which announced over the weekend that they’re looking to sell part of their portfolio that’s currently allocated to gold and use it to buy bitcoin.
Christopher Wood, who serves as global head of equity strategy for Jefferies, noted that this is the first time in several years they have reduced their gold holdings.
Further, they are willing to add more should we see a significant dip below the current highs.
We’ve joyously added Wood and Jefferies to our fund managers gone crypto list, which is available at this link.
What dip?
Looking at the charts this morning, it seems like Woods may just get his wish, or may have gotten it already, for all we know.
He didn’t really specify what type of entry price would motivate them to buy more.
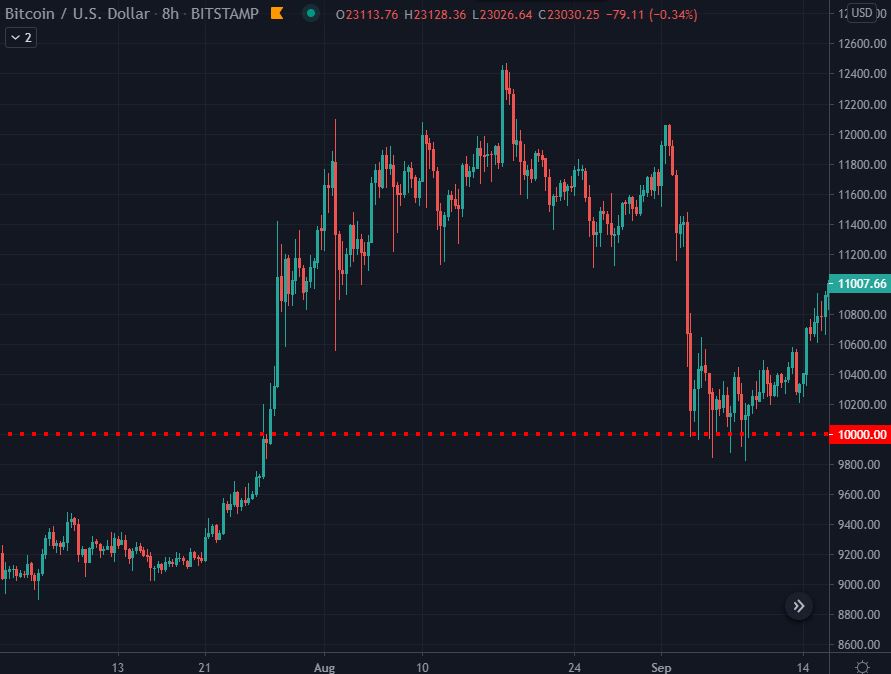
As of this writing, bitcoin has come down from the recent highs around $24,000 to $22,000, indicating that the force from our $20,000 breakout has finally ebbed.
What Woods was talking about though is pretty clear. As we know, assets almost never move in a single direction, and in a bull market, pullbacks tend to be the best entry points.
Many of you will recall that when we blasted through $10,000 at the end of July, it took more than a month of consolidating near the top before we eventually retraced back to test that level as support.
As we know, past performance is not an indication of future results. In other words, just because that’s what happened at the last round number, it doesn’t mean that it will necessarily act the same this time, but it certainly wouldn’t surprise anyone, especially not a seasoned trader Wood.
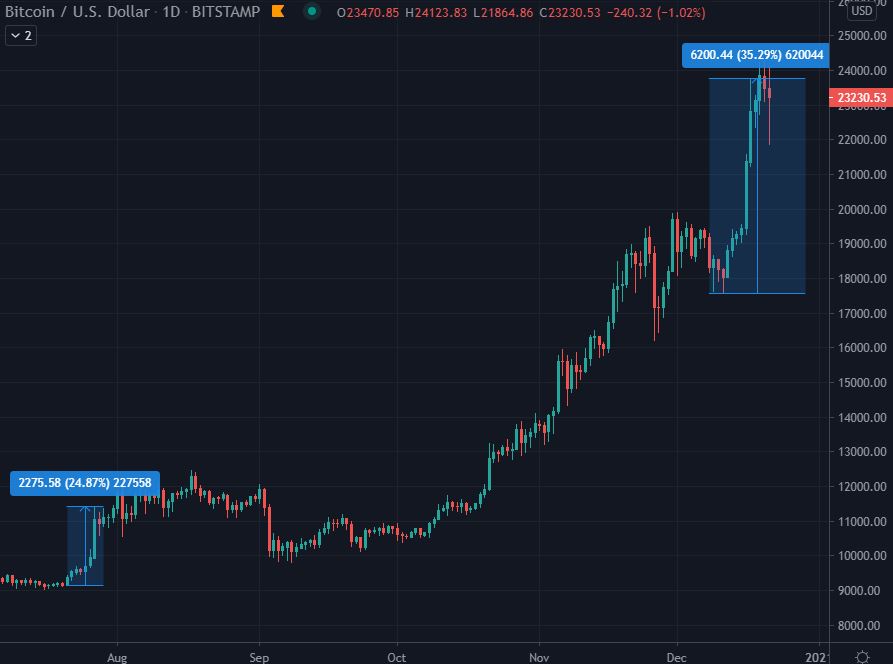
Another thing to consider is that last week’s breakout was notably stronger than the one in July.
In this chart, we can see the respective force of both movements. As we can see, July’s breakout represents a movement of approximately 25% from start to finish, whereas December’s was closer to 35% from trough to peak.
Why dip?
Of course, financial analysts love finding specific reasons for every price swing.
The fact that it’s made a tremendous move and is now retracing is hardly a good enough explanation.
Now that the institutional types are here, let’s give this a whirl.
Here’s a rather well-timed article quoting the analysis of Tom DeMark, whose timing model was also triggered at two previous bitcoin peaks, once on Dec. 18, 2017, and the next on June 26, 2019. Crypto traders know these dates well.

Of course, as we mentioned in Thursday’s BMJ Newsletter, which has been widely circulated thanks to the good people at Cointelegraph, this rally has rather different fundamental drivers, and we really shouldn’t be using any old yardsticks to try and measure what’s possible this time around.
Also, as we can see by the date on the above article, this analysis has clearly missed the peak, as we have notched a higher high since it was written.
Not to discount DeMark or his models, because literally anything is possible. He personally notes the treacherousness of his stance within the analysis.
Of course, another analysis coming from within the crypto community reaches a rather similar conclusion using data from Binance futures versus those of ByBit. It’s interesting stuff. I’m not selling.
