The term market manipulation is often thrown around within the crypto space, as the light trading volume means that many minor tokens can be easily moved around with relatively small orders.
In larger markets, it takes a lot more money to move the needle, and they are less susceptible to manipulation, except in some cases where market manipulation is actually celebrated.
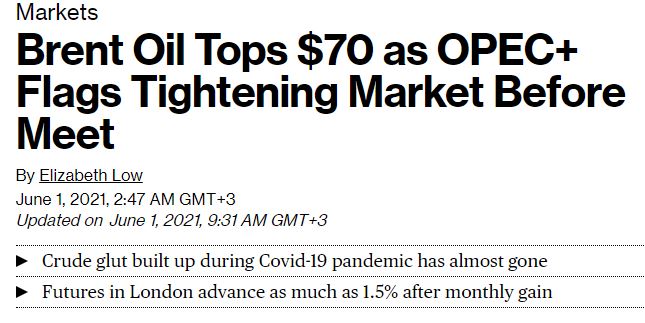
One such asset is crude oil, where the Organization of the Petroleum Exporting Countries (OPEC) has been intentionally controlling output in order to push around the price for decades. One such headline, involving these countries and their allies, known as OPEC+, can be seen today. …

By definition, OPEC is a price-fixing cartel. Everyone knows that it’s a cartel, and yet traders and the financial media, as well as global regulators, seem to go along with it anyway.
Instead of drawing criticism, their successes are in many cases cheered by market participants.
This has always been a bit perplexing for me, as I was under the impression that information that has the ability to move prices should generally be free and fair.
However, in this case, delegates from the OPEC member countries tend to hold closed-door meetings to determine what the price should be and how they can collectively change it.
They’re not always successful, of course. The invisible hand has a way of blowing them off when they get overly aggressive, but still, they’re successful often enough that the delegates themselves tend to have the upper hand against the home trader.
And some people wonder why we need decentralized markets.
Manipulable
That said, reading signs from the Bitcoin network, it does seem to be slightly more vulnerable to manipulation.
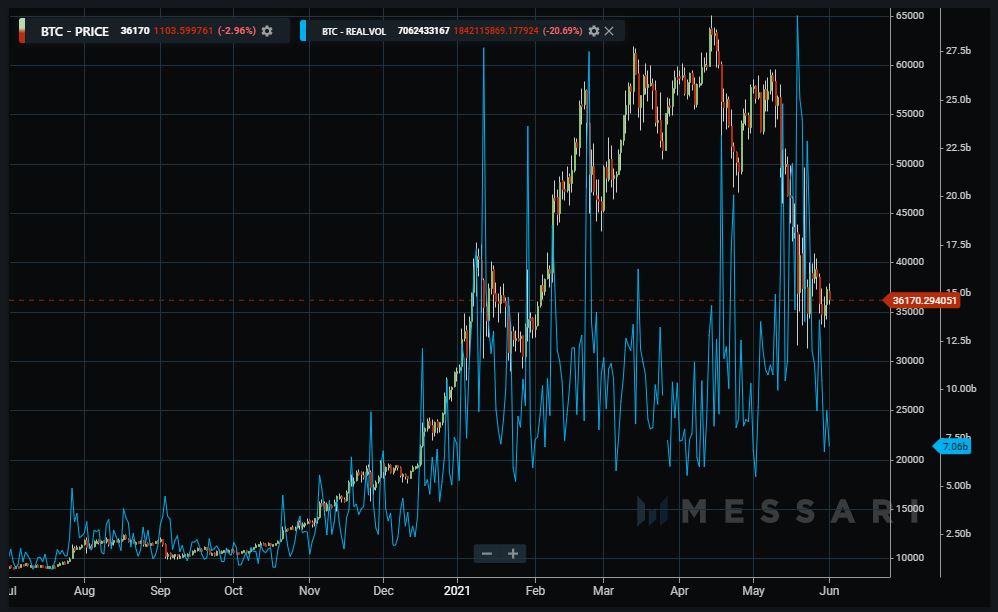
I’m not just talking about FUD from the likes of Elon Musk and the Chinese authorities. It seems that during the recent shakeout, bitcoin volumes, especially on crypto exchanges, have plummeted.
Messari’s real volume metric, which hit a new all-time high of $29.4 billion during the May 19 drop, is now reading just above $7 billion in the last 24 hours.

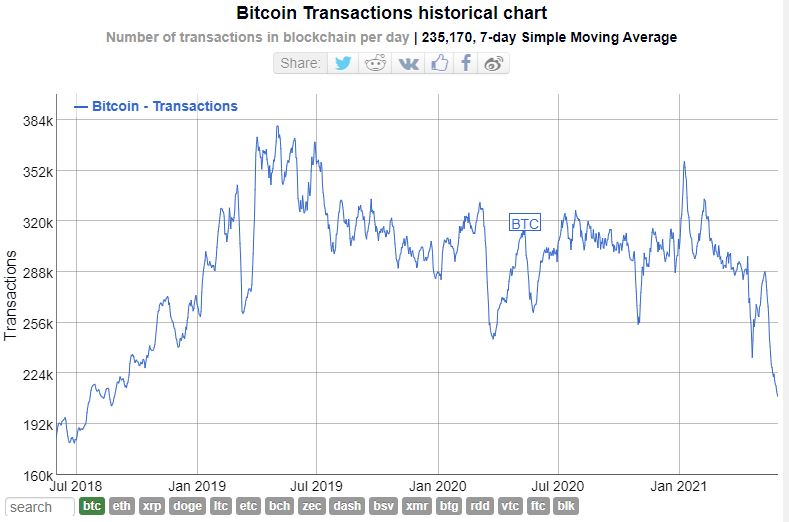
On the Bitcoin blockchain itself, we can also observe that the number of transactions per day has been trending downward since April and recently fell through the floor due to lack of excitement.
A transaction I sent yesterday went through in about two minutes flat, and I’m glad I didn’t pay extra for quicker processing.

That said, it’s important to point out that even though the number of transactions is falling fast, the amount of money flowing through the network doesn’t seem much affected at all.
Now, I know that the big buyers tend to place their entry orders tightly under the price so as not to make their future purchases more expensive.
But, if a large buyer did want to send the price up with big market orders across different exchanges, now would be a really good time…just saying.
Getting technical
The crypto market is decidedly down today, in contrast with the stock markets.
No particular reason for this comes to mind other than consolidation near the lows and “follow the leader” mentality.
Sure, there are a few small-cap cryptocurrencies going up, but that’s the nature of a market where short-term leverage traders tend to chase the pumps.
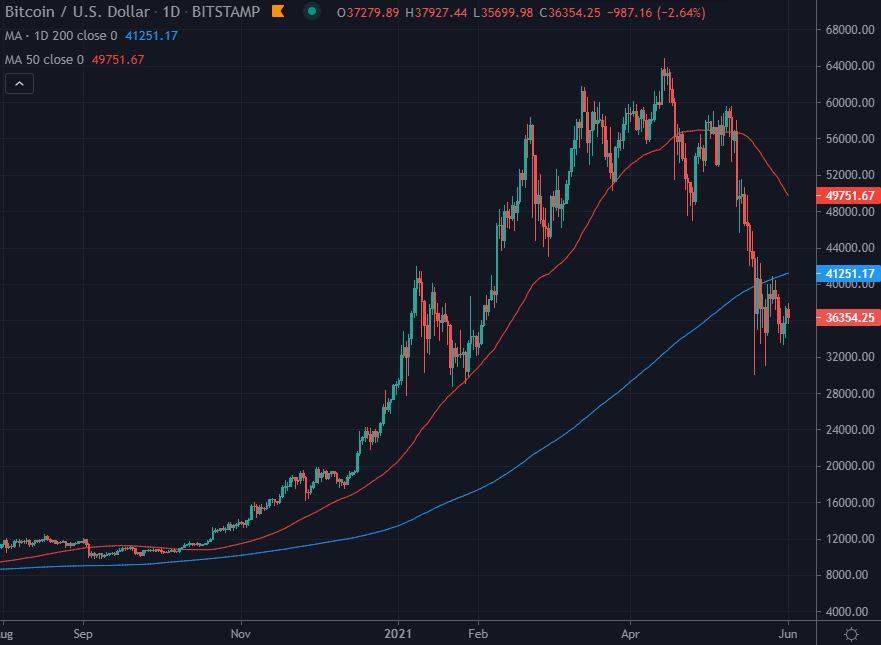
The 200-day moving average (MA) (blue line) may signify resistance for chartists, but to me, it screams cheaper than usual. The 50-day MA (red line) seems to confirm this from my end, and I’m starting to get really bullish again.


