
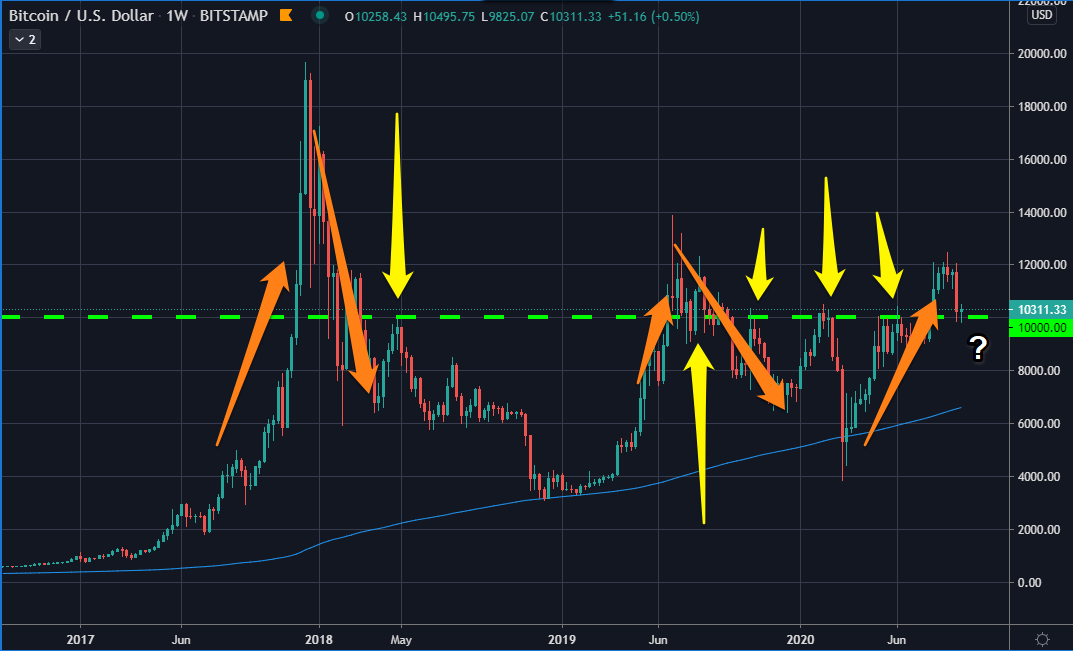
In its short history, bitcoin has significantly crossed the level of $10,000 a total of five times. (Orange)
It has used this same level as a turning point (support and resistance) the same number of times. (Yellow)
On its 11th interaction with this level in three years, will it hold or will it break?
Bitcoin’s prices are determined by dozens of regulated and unregulated exchanges distributed across the globe 24 hours a day, seven days a week.

If you ask me, it doesn’t matter much. The line we really want to watch on the chart above is blue, not because it tells us the future, but because since its inception, the long-term average price is on an extremely steady incline.
So the levels below our dotted green line seem even more attractive to long-term holders.
On the other hand, should it hold this level and shoot straight for the moon, we could see another bubble, which tends to get lots of people rekt. So maintaining this steady incline would arguably be the more levelheaded course for a levelheaded asset.
