
Many thanks to those who sent in their feedback on yesterday’s newsletter. I really appreciate the excellent questions, opinions, and insights you guys are sending every day. This is my main source of inspiration when writing.
It’s true, the media does like to blow things out of proportion and financial commentators love nothing more than to find a comfortable narrative to explain why prices are moving on any given day. To me, it does seem like this is exactly the case with the new Coronavirus craze. The death toll is now up to 107, all in China. To put things into perspective though, the World Health Organization estimates that various strains of influenza are responsible for between a quarter and half a million deaths per year. So, really… what’s new about this strain?
No doubt the lockdown in China and the extension of the New Year break will have a noticeable impact on the local economy, and since China makes up a significant portion of the world’s GDP, it makes sense that stocks are cooling off. On the other hand, the markets have been overheating of late and this little de-leveraging session may well have occurred with or without a pandemic scare.
For those wondering how the news is affecting bitcoin and the other cryptos. My feeling is that the impact is less than zero. Despite recent signs of integration, cryptoassets remain largely uncorrelated with traditional markets.
Though we did see a limited but clear reaction to the US airstrike in Iraq earlier this month, that correlation broke down quite quickly. It was perhaps the first time since 2013 that we saw bitcoin acting as a general safe haven in the face of geopolitical risk and such instances are likely to remain extremely rare for the foreseeable future. The attempt to call bitcoin a ‘safe haven asset’ and to point out correlations with every headline actually seems a bit comical.
Yield Slump
One thing that did catch my attention from all this volatility in the markets are some interesting movements in the bond markets.
Back in August, there was quite a scare in the markets that an ‘inversion of the yield curve’ might be pointing to some economic distress on the horizon. At the time, many economists including myself, were giving a 50% chance of a global recession this year. However, with much thanks to the Fed, the yield curve had since corrected itself. However, looking at the rates today, we can see that some level of inversion does seem to have crept back in.
The following graph shows the various yields (y axis) that the market is giving for different bond time frames (x axis). A yield inversion is generally apparent when the yield on the 10-year bond drops below that of the 1-year.
At present time, the 1-year is still below the 10-year, but the 2,3, and 5 seem to be in a bit of a slump.
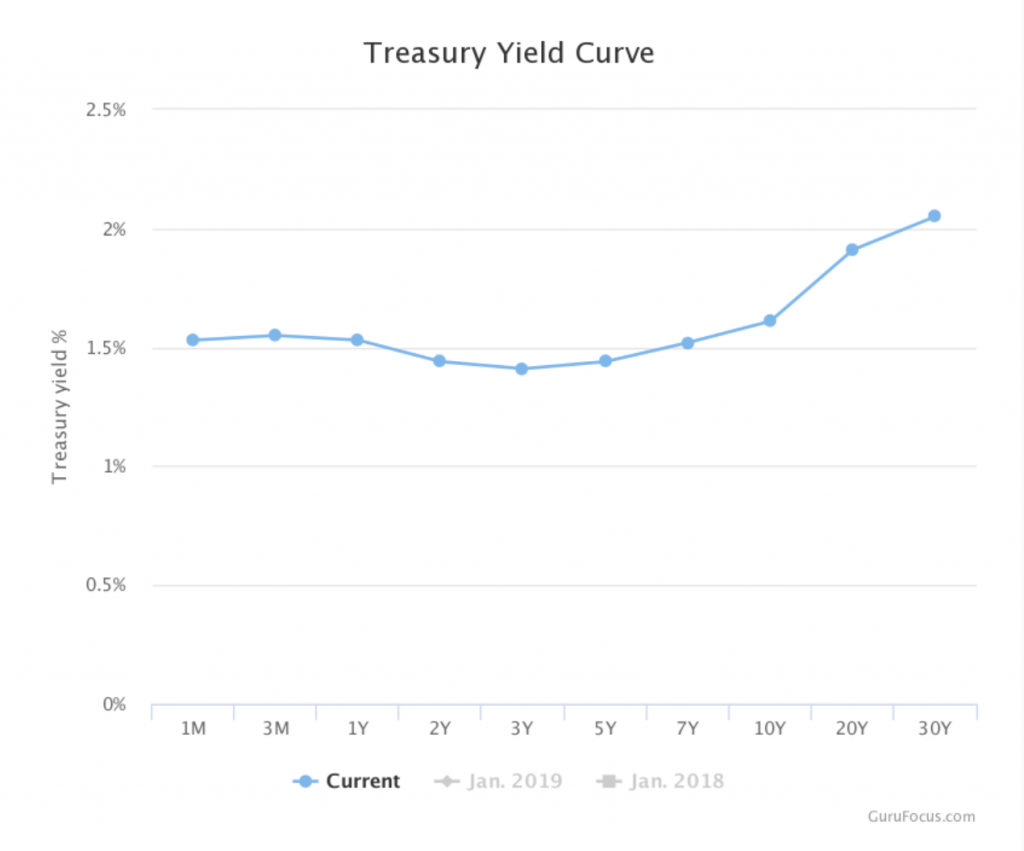
Could be nothing but worth keeping an eye on. Will check again after the Fed show tomorrow.
Hard to Vegeta
A running joke in crypto circles on social media is playing out again today. Enter the Vegeta meme.
Though, I’m not quite sure who started it, every time the price of bitcoin moves above $9,000 per coin my twitter feed is flooded with images of a Japanese anime charterer named Vegeta. Of course, I’d never heard of him or even the Dragon Ball Z series from whence he hails, but apparently the line he’s famous for is…
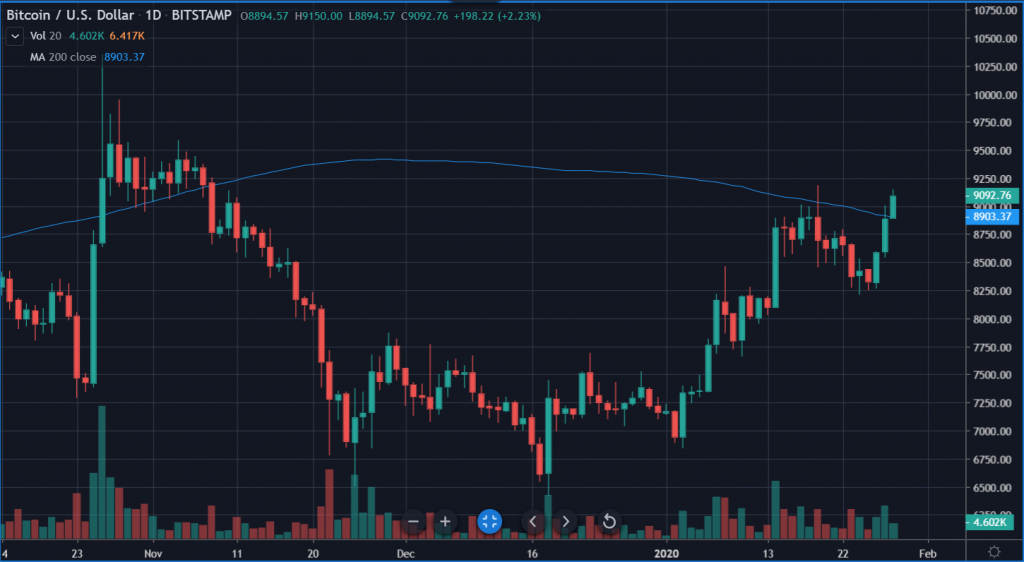
Yesterday, this little guy had myself and many others glued to the charts while BTC very gradually teased us cryptotraders for several hours. At one point it climbed all the way up to $9,000.00 and just sat there for about 30 seconds before falling back down. Quite frustrating.
By now though, we do have a firm breakout and I did personally see enough giffs to eventually achieve satisfaction.
Kidding aside though, the more important level that has now been broken is the 200 Day Moving Average, which we’ve been discussing in these updates and is currently calculated at $8,903. The movement may not seem like much but this is actually a significant bullish signal.
Let’s have an amazing day ahead!
