
Whatever might have been perceived as risk-off sentiment in the global markets earlier this week has now completely disappeared as a broad rally has been sparked across the board.
The shining star by far has been Tesla, which seems anxious to reach Mars before SpaceX has a chance to get there. This graph is unlike any other stock I’ve ever seen before. The massive 212% pump from October until today makes the rest of Tesla’s massive price swings see almost flat.
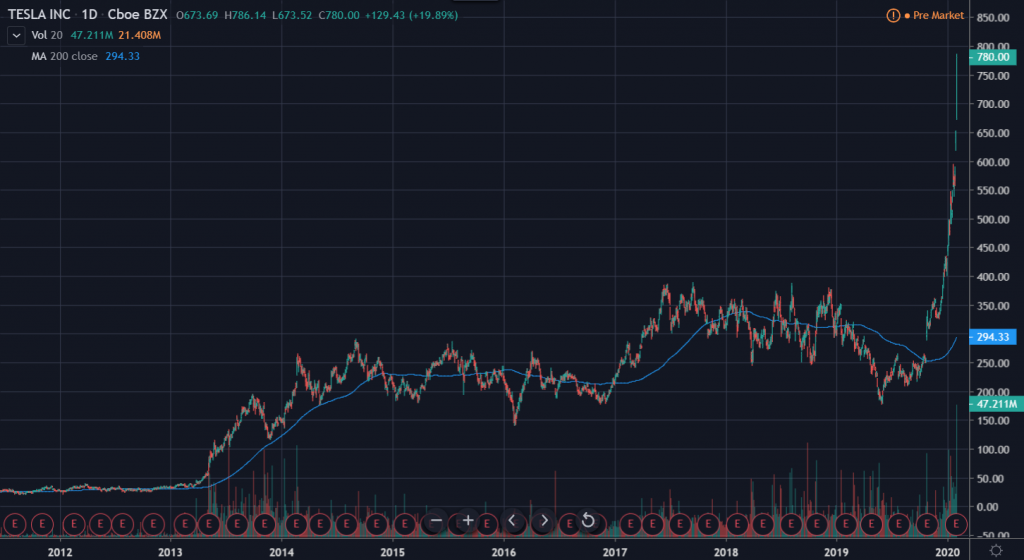
Not included in the above chart are the afterhours trading activity, which seem to be rather astounding as well. By now, Tesla’s market cap of $140 billion is now larger than Ford, General Motors, BMW, and Harley Davidson… combined.
Kind of makes me wonder just how happy the Fed and daddy Powell are to see where all their newly printed money is going. ¯\_(ツ)_/¯
A Wet Donkey
In short, the Iowa Caucus that we discussed yesterday ended in disaster. Apparently, the people who were responsible for aggregating the results coming in from the various polling places muddled the data and the winner has, to this moment, yet to be announced.
So instead of giving a single candidate a leg up in order to begin building momentum, in true political fashion, all the candidates are claiming victory. The whole ordeal almost reminiscent of the Jolly Caucus Race, which was covered by Lewis Carroll in his blockbuster 1865 book Alice in Wonderland…

Perhaps some of you are more familiar with madness of the video version as portrayed by Walt Disney in 1951.

Whatever the analogy, at this point, the results of Iowa will be nearly worthless as by the time they’re announced the news cycle will have moved on to other events and other caucuses.
Financial markets couldn’t be happier about the Donkey’s (read: Democrats) wetness and are only too happy to see them running around in circles. Analysts are already starting to look forward to the US jobs report on Friday.
Bitfinex Billions
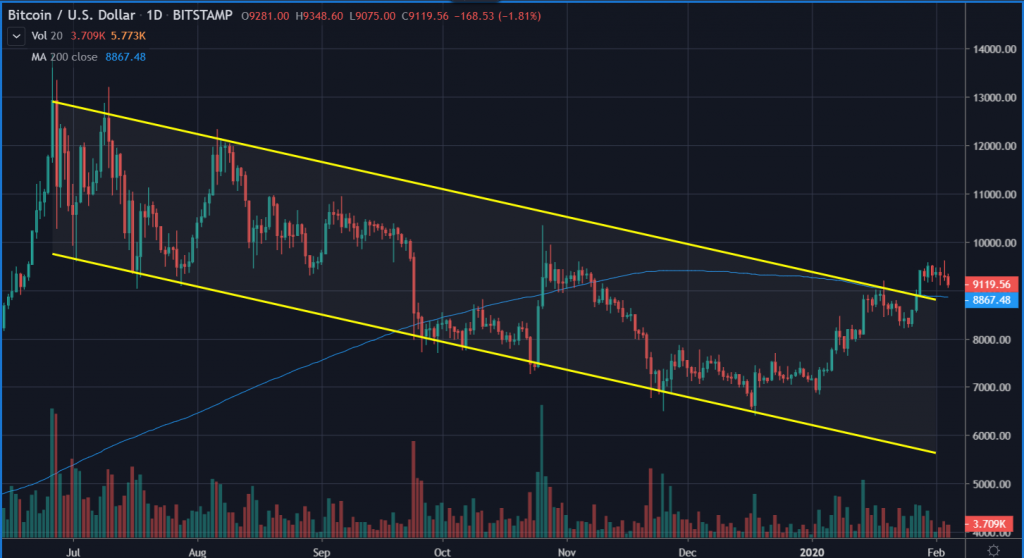
As we continue to consolidate, it seems that a touch of gravity has set in. So far the red numbers have been extremely mild, which is a great sign as this is exactly the type of price action that tends to lead to a bullish flag.
As far as technical analysis is concerned, we’d be looking to test the 200 DMA as support. So basically, a kiss of that blue line without breaking below would likely signal a blast off pattern en route to the moon. (Past performance is not an indication of future results.)
On the fundamental side, I wanted to call your attention to the following graph showing the estimated USD volumes processed on the Bitcoin blockchain, which yesterday registered $3.5 billion. It’s highest level since the 2017 bull run.
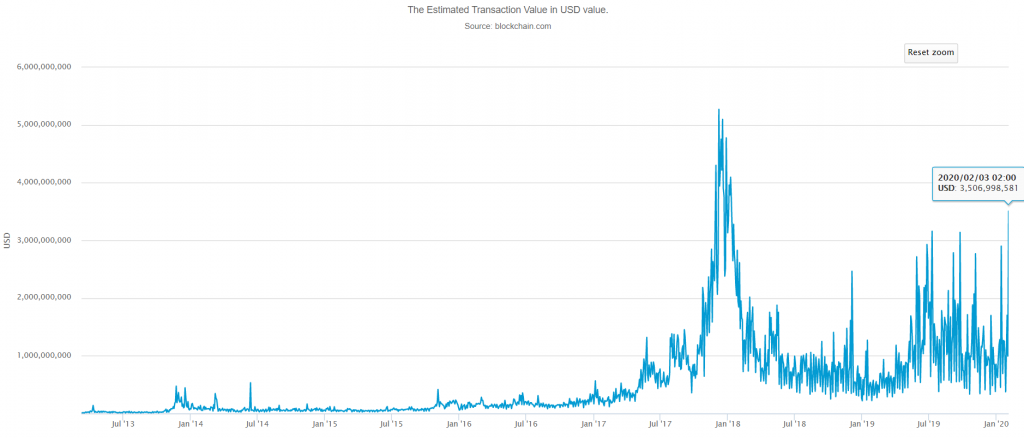
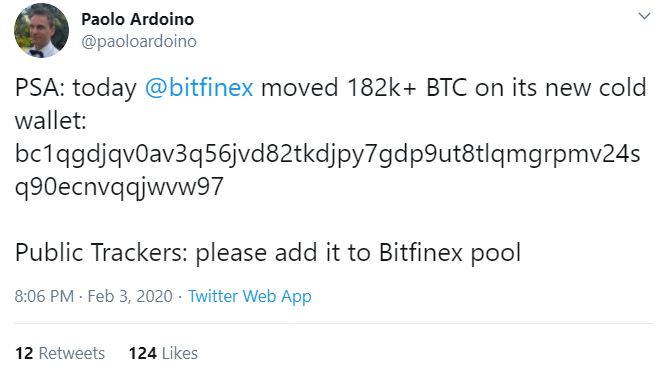
Perhaps not too exciting though after finding out that about half of those volumes were due to a single exchange who was simply reorganizing their finances.
As always, many thanks for reading the updates and sending over your questions and feedbacks. It’s always appreciated!!
