Many of you may not have noticed, but the Bitcoin network has been running a bit slow lately.
Of the many metrics we can use to visualize the throughput of the legacy blockchain, the average block time is probably the most dramatic.
Here we can see that the average time it takes to mine a block of bitcoin has jumped to its highest level since the time when Satoshi and Hal Finney were the only ones using the network.
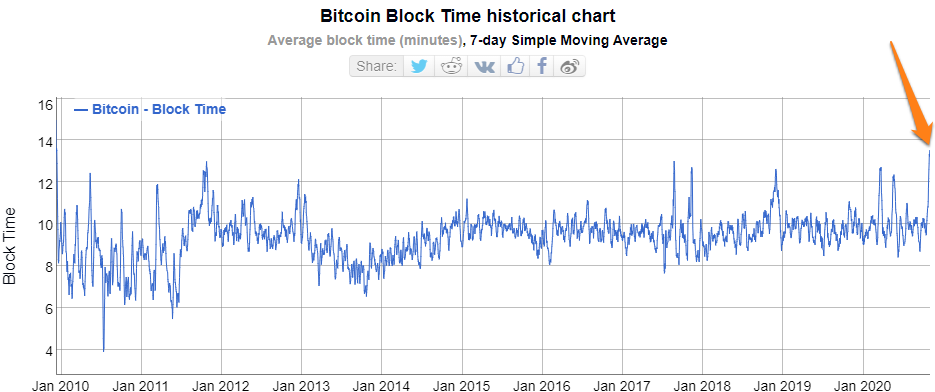
Ten minutes is usually the baseline, but in the last week, we’ve seen it as high as 15. As can be expected, all of our other favorite metrics saw remarkable spikes as well.
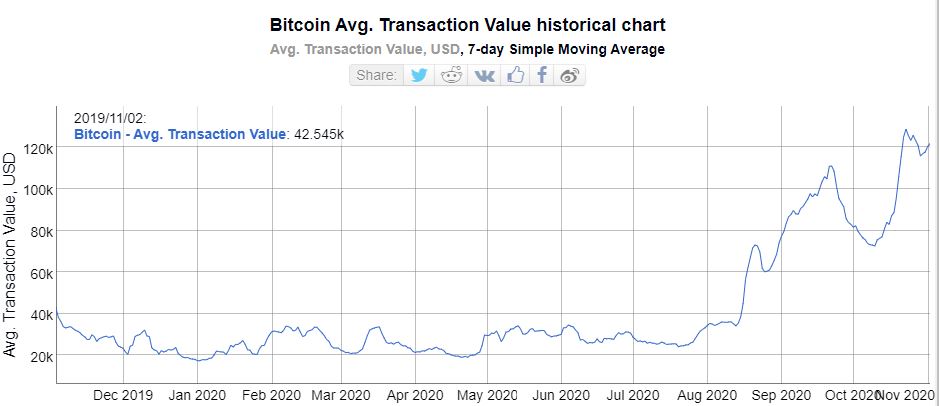
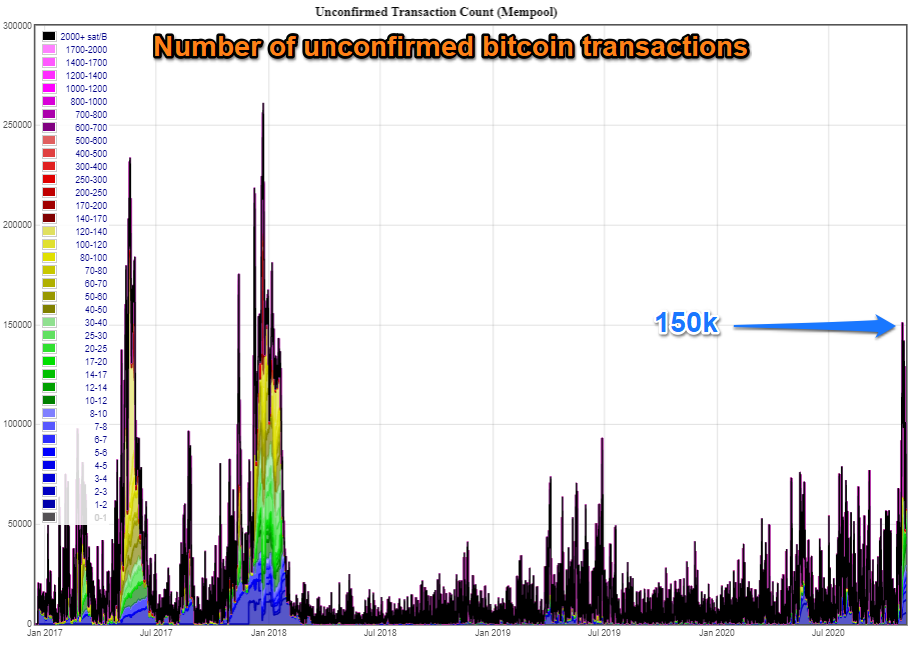
The average cost to send bitcoin shot up to $13 for the first time since the great bull run, as did the mempool . . .
Memory overload
This chart shows the number of bitcoin transactions that are currently waiting to be confirmed by the miners. As we can see, last Wednesday saw a total of 150,000 unconfirmed transactions, a number not seen since early 2018.
For those who are used to looking at these metrics, however, there’s a simple explanation as to what happened, and it’s certainly not any cause for great concern. The answer is actually seasonal.
As the dams in China start to dry up, they turn off those massive hydroelectric facilities, and the miners there are forced to go elsewhere. It’s not hard to imagine those complex machines being trucked from Sichuan to Xinjiang to be plugged in at a new location, likely with higher electric costs, meaning thinner margins for those guys.
So yes, it does seem to be related to the great Chinese bitcoin mining industry.
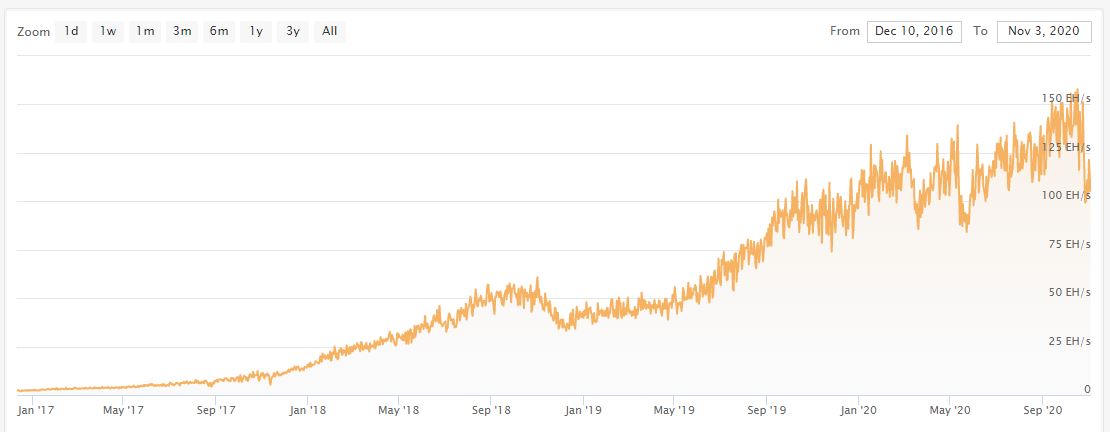
For those who might be concerned about those guys cornering the market and possibly using their collective influence to hack the network, don’t. Here’s the graph where we can see the drop in hash rate.
Yes, it is dramatic, somewhere around 33% from peak to trough. Still, most of the hash rate that was lost had only been acquired recently, so this is more of a reversion to the mean and nowhere near a vast majority.
Of course, as it is designed to do, the Bitcoin network autocorrected itself by lowering the difficulty levels associated with mining a block.
This reset the block time back to 10 minutes, cleared the mempool, and sent the fees back to where they belong.
More valuable indeed
Perhaps it’s just me, but analyzing this data over the last few hours, I can’t shake that there’s one more insight to learn from this ordeal.
The rate of transactions on the network dropped. That much should be obvious. Users would rather wait on the side for a week rather than pay $10 to have a transaction sit in the mempool for hours.
This situation may have helped cause the average value per transaction to increase during the week of the congestion, not that it hasn’t been rising anyway.