
Chart analysis is one of the most popular tools in the arsenal of seasoned bitcoin traders as it uses price data and, thus, takes emotions out of the equation. Here, we discuss how you can use Moving Averages (MAs) to help you with your bitcoin trading decisions.
What Are Moving Averages (MAs)
Moving Averages (MAs), also known as Simple Moving Averages (SMAs), are calculated by adding the closing prices of an asset and dividing that by the number of time days in the chosen time range. The idea behind this is to smooth out the volatility to show price trends more clearly.
In our example chart, we have used 10-day and 25-day moving averages, which are commonly used by traders. However, the number of days used can be customized and depends on your investment horizon.
Shorter moving averages will respond more quickly to trend changes, while long moving averages will take longer to react and, thus, show longer-term price trends.
How to Use MAs to Trade Bitcoin
In the chart below, we can see how a 10-day and a 25-day SMA show the price development of bitcoin in June and July 2019.
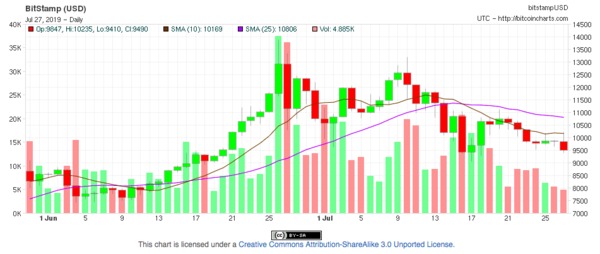
To use SMAs to trade, you need to look at where the shorter moving average passes through the longer moving average. If the shorter moving averages passes through the longer moving average from the bottom up, that would be considered a buy signal. If it drops below the longer moving average, it would be considered a sell signal.
On the chart above, you can see that when the shorter SMA crossed over the longer SMA on June 17, it confirmed the positive upward price trend of bitcoin and, thus, indicated a buy signal.
Moreover, on July 17, when the shorter SMA dropped below the longer SMA, it confirmed a bearish trend and the price of bitcoin continued to drop in the days to follow.
Moving averages are extremely popular technical indicators that every chartist looks at to analyze trends. However, they are best used in conjunction with other indicators. By combining a number of technical indicators, such as MACD, RSI, and Bollinger Bands, stronger trade signals can be generated. For example, when all four indicators show a buy or a sell signal, you can likely be more confident in making a trade.
Related Articles:
- Bitcoin Trading: What Is a Trailing Stop and How Does It Work?
- How to Use Bollinger Bands for Bitcoin Trading
- Best of Bitcoin: Top 5 Charting Tools
Subscribe to the Bitcoin Market Journal newsletter to discover the latest investment opportunities in bitcoin, altcoins, and blockchain assets.
