
| Valuation Metric | Pros | Cons |
|---|---|---|
| Total Value Locked | Looks impressive | Vanity metric |
| Total Users | Measures real humans | Doesn't measure activity |
| Unique Active Wallets | Measures human activity | Subjective |
| Total Gas Used | Measures real usage | Hard to find |
As blockchain investors, how do we know if we’re getting a good deal?
I am convinced about the long-term value of Ethereum: it’s the “Infinite Machine” that these new blockchain apps are being built upon. Like Windows or Android, Ethereum is the operating system for the new world of money. That makes Ethereum very valuable indeed.
But how valuable?
CoinDesk just ran an interesting series of webinars on How to Value Ethereum. Because you don’t have time to sit through two hours of videos, I’ll summarize them for you below, along with the relevant takeaways at the bottom. (If you’re busy, just skim through the parts in bold.)
Metric 1: Total Value Locked
This metric has made all the headlines this year, driven in part by the much-hyped chart on DeFi Pulse.
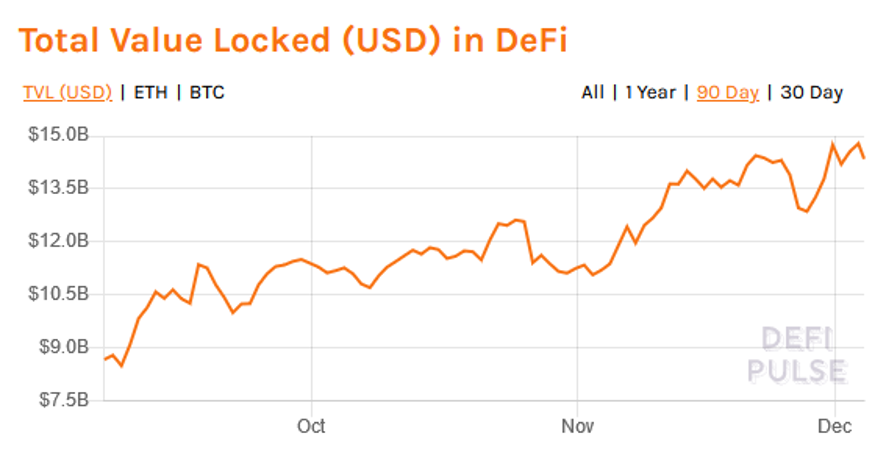
Total Value Locked is the total of digital assets held in DeFi smart contracts, multiplied by the current dollar amount of those assets.
In the webinar, Ilya Abugov of DappRadar described TVL as a “marketing metric,” and I agree. What he meant was that TVL helps to show hype around the industry, but it’s not so useful as a measure of value. (Instead of “Total Value Locked,” think of it as “Total Vanity Locked.”)
The reason is that Total Vanity Locked is denominated in US Dollars. So as the price of Ethereum goes up, the TVL goes up, even if there’s not a corresponding increase in usage.
Real human users are the real value in blockchain. TVL confuses real human users with price fluctuations.
(To solve for this problem, DappRadar also calculates an Adjusted TVL, which tries to smooth out prices using a 30-day rolling average. It’s an improved version of Total Vanity Locked, but still far from perfect.)
A better metric of real human users is Unique Active Wallets, also covered in the webinar. In a traditional tech company like Facebook, this is analogous to Monthly Active Users, a valuable metric to show whether people are more or less engaged with Facebook (i.e., whether they log in monthly).
Unique Active Wallets sounds simple, but it’s complicated. Over what period of time do we measure whether a wallet is “active”? Daily? Monthly? Yearly? What if someone has a wallet but is just holding ETH long-term – shouldn’t they be counted?
It’s also hard to find good data on UAW. DappRadar lists UAW on its DeFi page, but it’s hard to believe their numbers. (For example, DappRadar reports just 931 unique active wallets for Compound over the last 24 hours, when we know from Dune Analytics that there are over 250,000 total Compound users.)
So we will file UAW under “not ready for prime time, but worthy of further study.” Which would make a really long folder name.
Metric 2: Number of Accounts
In this webinar, Joanes Espanol of Amberdata spoke about measuring the number of Ethereum accounts as a way to value Ethereum.
Let’s pretend that Ethereum is a global bank. If we measured the number of customer accounts that were being used in any given month, wouldn’t that give us some idea of the value of the bank?
The first problem is that bank accounts can hold a little bit of money, or a lot. So if the bank has 100 very rich customers, it’s potentially more valuable than 1,000 customers who are constantly bouncing checks. So number of accounts is not very useful to show us absolute value.
The second problem is that some accounts are held by humans, and some are held by smart contracts. When people enter into a smart contract (which is the foundation of blockchain), those smart contracts sometimes create their own accounts.
To put it another way, if you and I each have an account, and we enter into a smart contract that creates a third account, we’re kind of double-counting our accounts. It would be like if you and I each had a traditional bank account, and we put some money in escrow: you wouldn’t count the escrow account as a new “customer.”

Metric 3: Transaction Volume
Liquidity is good. Nature rewards liquidity, whether it’s in a fresh mountain stream or a healthy circulatory system. This applies to money — and digital money — as well.
Transaction volume is a measure of liquidity: the more transactions are flowing through the Ethereum network, the more liquidity. Here our bank analogy holds up: if we look at the number of transactions flowing through a bank, it’s a better measure of the bank’s health than the number of accounts (since accounts may be dormant).
To get a sense of how Ethereum transaction volume is growing, here’s a chart that predicts Bitcoin vs. Ethereum transaction volumes through the end of 2020:
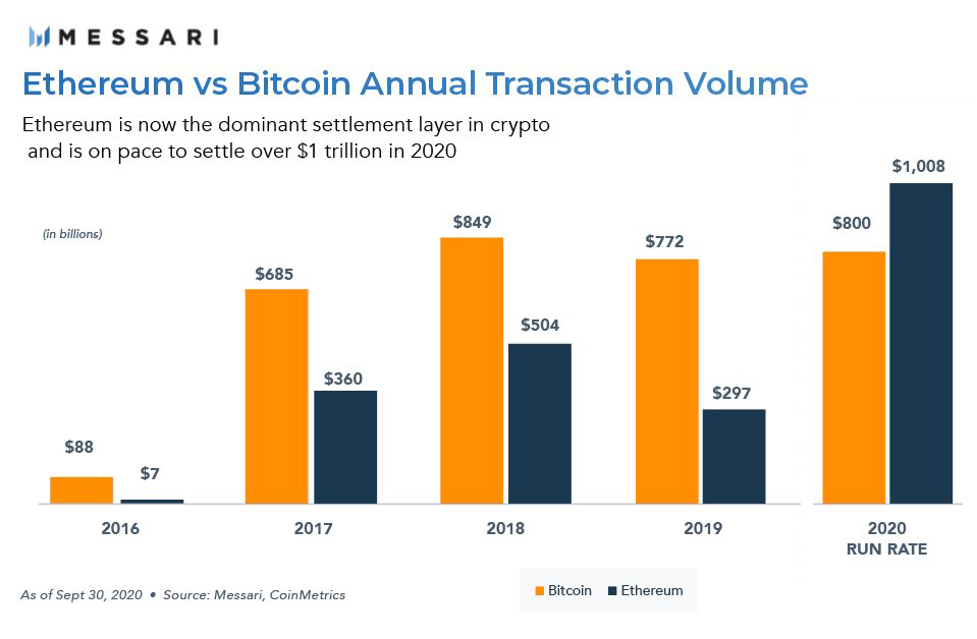
The big takeaway from this webinar is that Ethereum is crushing bitcoin in transaction volume. At this pace, Ethereum will have moved over $1 trillion in annual transactions by the end of 2020: the first digital asset to do so.
Ethereum and Bitcoin, remember, are two different things. Bitcoin is just an asset, like gold. Ethereum is an entire asset class. It’s the default operating system for blockchain. It’s where all the action is. This is why that blue bar has shot past the gold bar in 2020: Ethereum is just so much more useful.
Why invest in Ethereum? Because that’s where the money is flowing.
Metric 4: Gas Costs
In this webinar, Fredrik Haga of Dune Analytics listed what I consider the most important metric so far.
Like so many things in blockchain, “gas” is a confusing term. (Blockchain developers: brilliant at math, terrible at naming things.) The simplest way to think about gas is a transaction fee for using Ethereum.
The original idea was that “gas” was the fuel that ran the Ethereum “machine.” You have to pay gas (transaction fees) to power the machine. If everyone wants to use the machine at once, gas prices (transaction fees) go up. If you don’t pay enough in fees, your transaction will “run out of gas.”
Remember: gas = transaction fees. It is just like paying a couple of bucks to withdraw money from an ATM … if the ATM charged you $2.00 some days, and other days (when a lot of people want to withdraw money) it charged you $10.00.
For savvy blockchain investors, this means gas is a built-in warning mechanism. When gas prices are high, it is a signal that you are investing on emotion.
Note this is not always true: if all the lemmings are jumping off the cliff, and you are running in the opposite direction, that could be a good sign. But usually you are trying to buy into some hot token at the same time as everyone else, which is why transaction fees are so high.
High transaction fees also eat into your profits, if you make any profit. If you lose money, high transaction fees make your losses worse. And because transaction fees are usually denominated in gwei (don’t ask), it’s hard to calculate in dollars. Avoid investing when transaction fees are high.
On the other hand, total gas used is an extremely useful metric, as shown by Christine Kim in her terrific Research Note:
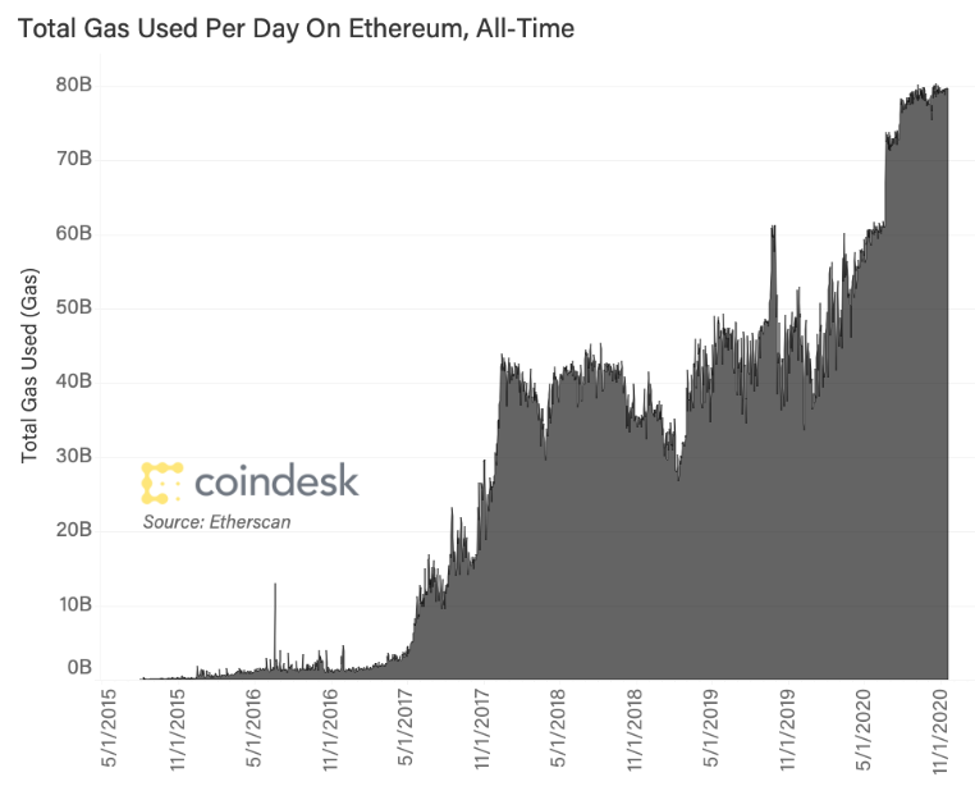
Note this is not total gas fees, but total gas used. In other words, price is removed from the equation, so we smooth out all the FUD and FOMO from the chart.
As an analogy, imagine we’re trying to measure the demand for cars at the beginning of the auto industry. We’re not measuring the money spent on gasoline for automobiles (since that fluctuates), but the total number of miles driven. More miles driven = more uses for cars = more demand for cars.
More demand generally means more value created. The chart above shows the increasing demand for Ethereum, which means it is being used to run increasingly valuable applications. In this sense, it is like measuring the demand for oil or gas. (Maybe they named it right after all.)
Total Gas Used can measure the demand for individual DeFi apps as well, though I am not aware of any source that has this data in a user-friendly chart (great project for an enterprising programmer).
The TL;DR Summary
- Though bitcoin still has the lead in market cap, Ethereum is potentially the most valuable digital asset on the market.
- This is because Ethereum is being used as a new “operating system” for DeFi applications, where bitcoin just stands there.
- This means Ethereum is likely undervalued, but no one knows how to measure its true value. Lots of data, mostly noise.
- Total Value Locked is a vanity metric (“Total Vanity Locked”); it’s helpful to see the hype around Ethereum projects, but avoid using it for investment decisions.
- The number of humans using blockchains are the most important driver of value. (The blockchain is about people.)
- For this reason, Total Users is a good metric, because it shows actual users of a blockchain – but it doesn’t tell you how many people are actively using them.
- Unique Active Wallets shows the number of humans actively using a blockchain, but it’s tricky to calculate, because there are different interpretations of what makes a user “active.”
- Total Gas Used is an excellent metric, because it shows the amount of “fuel” that is being used to power Ethereum (or any given DApp), removing price from the equation. But it’s hard to find.
As of today, I personally use Total Users as my rule of thumb for investing in DeFi (see my articles on “How to Invest in Defi” here and here). I understand this metric is not perfect, but no single measure of money ever is.
Bottom line, the blockchain is about people. If the number of real people using a blockchain is shooting up, and they’re getting real value from that blockchain, it’s probably a pretty good investment.
More value = more value. That’s an equation we can all agree on.
John Hargrave is the co-author of Blockchain Success Stories: Case Studies from the Leading Edge of Business.
