

Summary: Our thesis is that the performance of crypto investments can be measured similarly to traditional stock investments. The key fundamentals for crypto investments are active users, fees and revenues, and hash rate – like the customers, revenue, and health of a company. This article shows you where to find them.
When it comes to analyzing crypto investments, there are two broad schools of thought: fundamental analysis (measuring the strength of the crypto “company”) and technical analysis (using tools like Bollinger Bands, Relative Strength Index (RSI), and Stochastic Oscillators).
At Bitcoin Market Journal, we’re big believers in fundamental analysis, which gives us deep insight into a crypto project’s strengths, and weaknesses. Done well, fundamental analysis shows us the “real” or “fair market value” of a cryptocurrency. Here’s how to do it well.
In this article:
- What is Fundamental Analysis?
- Applying Fundamental Analysis to Crypto
- Common Metrics
- Key Indicators
- Good Data Sources
What is Fundamental Analysis?
All investments have an intrinsic value: a company’s stock, for example, is influenced by its revenue, customers, market position, and so on. The discipline of studying the economic and financial aspects of a stock or security is called Fundamental Analysis (FA).
Fundamental analysis involves looking at microeconomic as well as macroeconomic factors.
At the micro level, the value of a stock could be affected by the management team, recent earnings, scandals, employee unrest, etc.
At the macro level, we have issues like regulatory changes, economic climate, inflation, and so on.
A fundamental analyst will try to decide whether a particular stock is overvalued or undervalued in the present market by looking at these internal and external factors.
This information can be beneficial in making investment decisions, namely, whether it is the right time to buy or sell. Crypto assets are no different.
Applying Fundamental Analysis to Crypto
The fundamental analysis of securities and stocks is a discipline that has evolved over the decades. We can trace its roots back to the publishing of the legendary book Security Analysis, written by Benjamin Graham and David Dodd, in 1934.
Many of the metrics propounded by the authors are still in use to this day in fundamental analysis. For instance, when looking at the value of stocks, knowing the earnings data of the company can be a huge help. You can use this to calculate earnings-per-share, or EPS.
The same data can also be used to calculate the price-to-earnings ratio, or P/E Ratio. If you know the financial statements of a company, you can also determine its solvency by looking at metrics like liquidity ratios.
All this is possible due to the stringent rules on financial reporting and investor protection in the corporate world. Firms listed on stock markets have to report their earnings in a consistent and easy-to-understand manner.
Cryptocurrencies are different. First, they are often decentralized networks, not traditional companies.
The bigger cryptocurrencies often have a more centralized agency at the helm, like a foundation or a team of developers. But these organizations do not have to follow any existing standards on reporting. (They don’t have to file quarterly reports.)
Instead, most crypto teams usually publish a transparent roadmap of their project and keep the community updated about all changes. Further, thanks to the nature of blockchain technology, all transactions are public and can be audited by anyone.
While they are traded much like stocks and securities on the market, tokens have a different DNA when compared to stocks or securities. Still, we can use common FA metrics as a jumping-off point.

Crypto Fundamental Analysis: Common Metrics
Despite the challenges, applying the basics of fundamental analysis to cryptocurrencies is still possible. The only difference is using a new breed of metrics unique to crypto tokens. These can be broadly divided into three categories: on-chain metrics, project metrics, and financial metrics.
On-chain metrics
Blockchain technology is built based on a core concept of transparency and decentralization. All the essential data is available freely on the chain – you just have to pull the data manually.
Many websites provide these metrics for investors. Noteworthy examples include Data Charts from Coinmetrics, project reports by Binance Research, and on-chain analysis by CoinMarketCap. (More resources below.)
Out of the several metrics available on the blockchain data, three are significant from a fundamental analysis perspective: active addresses, revenues and fees, and hash rate/total staked.
Active Addresses
Active addresses refers to the total number of active blockchain addresses over a specific period (like customers of a traditional company). Because blockchains have network effects, more active addresses tends to lead to more developers, which leads to more users, in a virtuous circle.
Conversely, a drastic fall in the number of active addresses can indicate fewer users on the blockchain: a project that’s losing momentum over the long term. Note that active addresses will nearly always drop across the board during crypto bear markets, and rise during boom times: the key is looking at long-term performance to see if a project is starting to turn the flywheel.
Revenues and Fees
Revenues refers to the value of any transaction fees or other value generated by a blockchain. When revenue is climbing, it generally indicates a healthy blockchain with more users receiving more value. Try looking at daily, weekly, or monthly revenues to spot short-term or long-term trends.
These are like the revenues generated by a traditional company, and are a critical metric for understanding how a blockchain is making money. Note that revenues are not the same thing as profits: generally speaking, revenues – operating expenses = profits.
Be sure to compare revenues between similar blockchain platforms as well, to see how they are stacking up against the competition.
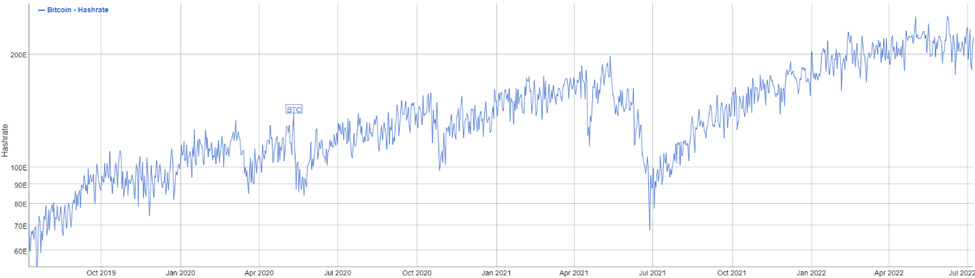
Hash Rate (PoW) or Total Staked (PoS)
Cryptocurrencies use different consensus mechanisms or algorithms. The two major types are proof-of-work (PoW) and proof-of-stake (PoS).
Bitcoin and several other major cryptos are PoW blockchains. On these networks, verification of transactions is based on solving complex cryptographic problems using high-powered computers. The individuals or organizations that do this are called miners.
This is where the hash rate becomes a valuable metric. It is the combination of all computing power used in mining on a PoW blockchain. If the hash rate is high, it is usually seen as a good sign. This is because it means more miners are on the network, implying a more secure network.
Conversely, a lower hash rate indicates reduced profits for miners. As a result, they might leave the network altogether and sell their hardware. Investors soon follow suit when a blockchain suffers from a fall in hash rates.
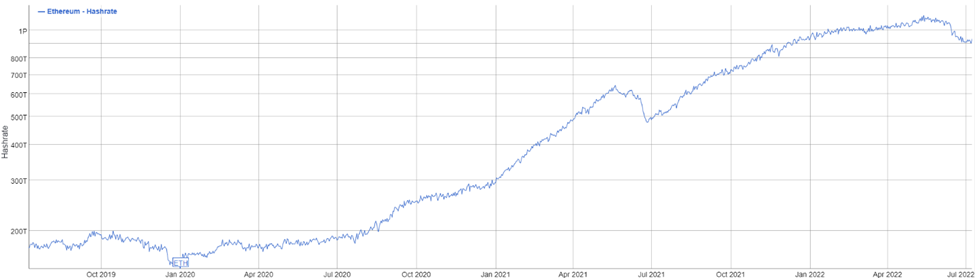
In contrast, the stake rate tells you how many users are staking their cryptocurrency on a PoS network. As stakers have “locked up” their money for some period of time to secure the network, it is generally a good sign to see a stable (or growing) stake rate. Be careful when it falls.
Project metrics
If on-chain metrics are focused mainly on the blockchain, project metrics try to look at the team behind the blockchain. While the former is a quantitative approach, project metrics is a purely qualitative approach that looks at things like the project background, whitepapers, competitors, project roadmap, and tokenomics.
Background Analysis
You can usually find information about a blockchain project team on the official website. These may include profiles and credentials of the individuals involved in the project. This can include both people who handle the technical aspect, as well as any major backers.
Experience and past accomplishments of the people behind a project often provide a good marker regarding the prospects of the crypto. Likewise, the presence of influential backers in a project is often a sign of the overall credibility of the project.
The Whitepaper
A crypto whitepaper is a technical document that provides a detailed introduction to the blockchain project. It is the most significant of all official documentation regarding a blockchain. A competent whitepaper will contain the following information at the bare minimum:
- The purpose behind the project
- Technology solutions used
- Use cases for the token
- A road map of planned features/upgrades
- Token economics
- Team background information
The contents of the whitepaper should always be taken with a pinch of salt: developers can often make tall claims to drum up interest in their project. Check the goals and technologies used to see if they seem practical or realistic. Look for public discussions around the paper; reviews can often highlight notable red flags.
Competitors
The future prospects of a new crypto token hinge on many things. Chief among them is its utility: does the new token provide innovative solutions to pressing problems? Or is it just another clone of a token that already exists in the market?
Looking at competing tokens and comparing the features can give you a good idea about the value of a token. The new token may have limited prospects if the ecosystem is already filled with similar tokens with the same features.
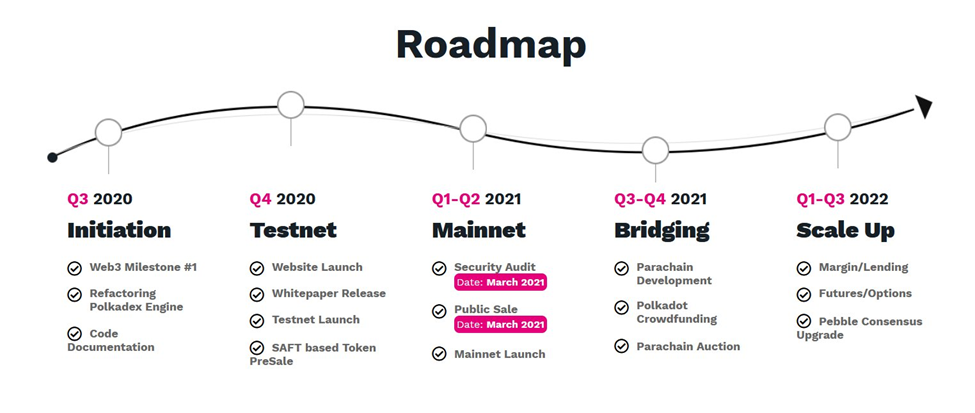
Project Roadmap
Virtually all blockchain projects provide a coherent roadmap detailing the project’s future trajectory. It will include a timeline for milestones, test nets, and new features down the line. The road map will give you a decent idea about the future of the crypto project and should not be ignored during a fundamental analysis.
Tokenomics and Utility
Tokenomics refers to the demand and supply economics behind a cryptocurrency token. The equation is straightforward – when the demand is high relative to supply, the token price rises.
The inherent value of a token is a more complex topic. It is driven by utility – the real-world problems a token can solve for its users. Tokens with more use cases will have a higher user-based, which can also drive its demand up.
Financial metrics
The overall financial health of a blockchain project is a critical focus for any serious investor research. Three core metrics are significant for this approach – the total market capitalization of the token, liquidity levels, and circulating supply.
Market Capitalization
When you multiply the circulating supply of a token by its current price, you get its market cap. This shows you the total amount you would have to pay to buy up all the existing supply of the tokens in the market.
In cryptocurrencies, the market cap is often an approximate value since the supply always keeps fluctuating – the team burns tokens, and users often lose their keys, rendering the tokens inactive.
On its own, a market cap can be quite misleading. Anyone can release a million crypto tokens – if someone buys one token at $5, its stated market cap would be $5 million. Still, you can use the market cap to figure out a blockchain’s potential for future growth.
Conservative investors look at large-cap tokens due to their popularity, perceived stability, and maturity. Others often look out for interesting small-cap tokens that may have the potential for explosive growth.
Liquidity and Volume
A liquid asset can be easily sold or traded on the market. A liquid market is filled with asks and bids for a token. In this highly competitive market, the bid-ask spread has a tight distribution.
If the market is illiquid, you may find it difficult to sell your tokens at a fair asking price. You are forced to either lower the price or wait for the liquidity to improve. To determine a token’s liquidity, you can rely on its trading volumes.
Data sources online usually depict the daily trading volumes of a cryptocurrency. High trading volumes indicate strong demand and high liquidity. It is a reliable indicator of the momentum of a cryptocurrency.
Circulating Supply
Blockchains use different types of supply mechanisms that can have a considerable impact on the future market trajectory of a token. Some coins have a low fixed maximum supply. Developers often burn tokens to reduce the current circulating supply.
In PoW blockchains, the level of mining activity can also increase or decrease the rate at which new tokens are added to the circulating supply. All these mechanisms can have implications for investor decisions.

Crypto Fundamental Analysis: Key Indicators
Fundamental analysis is like the proverbial story of trying to describe an elephant without sight: depending on where you touch the animal, you only get a limited account of its shape. Similarly, looking at one metric will only give you one part of the story.
It would help if you used multiple indicators and metrics to get the complete picture. These are some of the most popular indicators and metrics for fundamental analysis of blockchain tokens:
Network Value to Transactions Ratio (NVT)
For cryptos, the NVT is similar to the price-to-earnings ratio used to analyze traditional stocks and securities. You get it by dividing the coin’s market cap by its daily transaction volume. The latter is used as a marker for the underlying value of the coin.
If the coin’s market cap increases while the transaction volumes remain constant, it is a sign that we may be entering a bubble. Conversely, if the price stays stable despite an increase in daily volumes, we could be entering a “buy” territory for the token.
Typically, an NVT ratio above 90-95 is considered a sign of overvaluation. At this point, the crypto may be entering a bubble phase of trading. Falling below that line indicates a market correction.
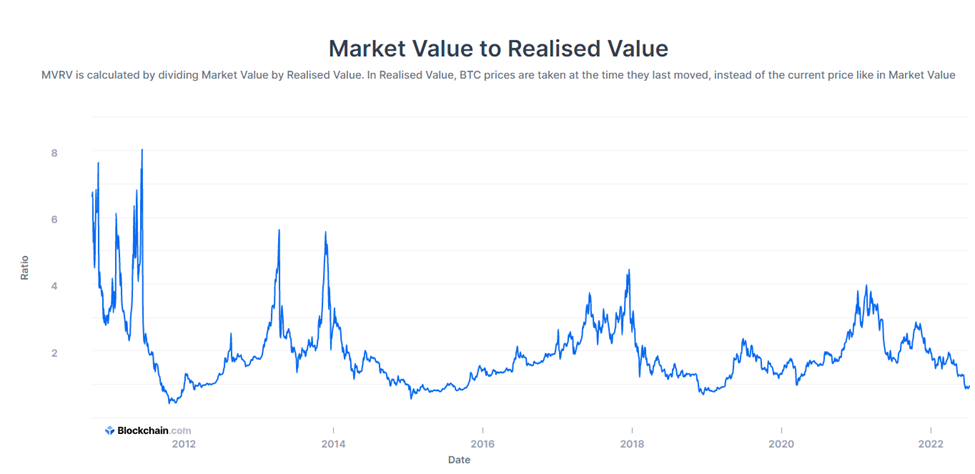
Market Value to Realized Value Ratio (MVRV)
Market cap looks at the total number of tokens in supply. Realized value accounts for coins stuck in lost or inaccessible wallets by discounting them. Inactive tokens sitting in a wallet are not counted at their present market rates. Instead, they are valued using the price at their last movement.
To get the MVRV indicator, you have to divide the market cap by the realized cap of the token. When the market cap is higher than the realized cap, we get a high ratio. Anything over 3.7 suggests that the coin may be overvalued and can trigger a sell-off.
In past sell-offs involving bitcoin, the MVRV has been consistently high – 6 in 2014 and 5 in 2018. When the MVRV is under 1, the market is undervalued, and probably a good time to buy the token.
Stock-to-Flow Model
In this model, cryptocurrencies are counted like gemstones or precious metals as a scarce resource with limited supply. Since many coins like Bitcoin have a known, limited supply and no new sources, investors often use them like gold – a store of long-term value.
To calculate this indicator, you have to take the global supply of the token and divide it by the number of tokens produced in a given year. Data on newly minted coins are readily available for blockchains like bitcoin.
As bitcoin mining becomes more difficult with decreasing returns, the flow of new coins also decreases, leading to a higher stock-to-flow ratio. If you look at the chart comparing the price of bitcoin and its stock-to-flow ratio, you will see a close correlation.
But this model is not without its flaws. At the present rate, bitcoin’s annual ratio will hit an astronomical 1600 in 20 years, more than the total projected wealth in the world. It also struggles with deflation in the market, with the ratio going into minus figures.
Crypto Fundamental Analysis: Good Data Sources
The following online data sources are quality sites that provide relevant cryptocurrency data and metrics for fundamental analysis:
Glassnode
 Glassnode is a subscription-based service that offers a wide array of on-chain metrics. A free service with limited options is also available for amateur/casual investors. The dashboard interface makes it easy to zoom in on relevant metrics quickly.
They also provide an array of charting tools with a built-in TradingView feature. This allows you to combine different types of data analytics in one place. The main advantage of Glassnode is the diversity in available metrics. However, it lacks options for Binance Smart Chain projects.
 Token Terminal
Token Terminal is a platform that tracks 6 of the major blockchain projects and over 100 decentralized finance (DeFi) applications. Like Glassdoor, it offers a free plan and a subscription service with more in-depth tools.
Token Terminal can track financial metrics of all the major blockchain protocols. However, this is not the ideal platform if you want to keep an eye on lesser-known tokens and DeFi projects.
 Messari
Messari is a website that provides a comprehensive online database for different cryptocurrency metrics. Similar to Crunchbase for legacy organizations, Messari delivers access to business documents, background information, team members, tokenomics, and more.
The site is extremely useful for the qualitative side of fundamental analysis. It has an excellent report system for easy access to relevant data in a digestible formal. Unfortunately, the advanced features are only available to subscribers.
 Baserank
Baserank is a cryptocurrency information platform that focuses on reviews. It provides research-based information on a wide array of crypto tokens. Then, based on various metrics and expert reviews, the site assigns a rating system for tokens.
The points max out at a hundred at the best-rated tokens usually sit around the 90 points mark. Baserank has multiple subscription plans ranging from standard and professional to an enterprise tier.
Conclusion
All investing comes with some risk. But you can greatly reduce your risk by doing smart fundamental analysis before investing. Most investors don’t do their homework: this gives you a critical edge.
With so many sources for high-quality data and metrics, you have easy access to everything you need to perform fundamental analysis on cryptocurrencies. The key is separating the signal from the noise; we hope this article has helped you do that.
Next step: Sign up for our free Bitcoin Market Journal newsletter. Premium members receive our weekly “Crypto Fundamentals” column, delivered every Thursday. Click to subscribe.
