

In a continuation of our ongoing series regarding quantitative valuation methods, this article will explore the Network Value-to-Transaction Ratio (NVT), a popular formula used to value digital assets.
Although the NVT Ratio resembles the Network Value-to-Metcalfe ratio, it provides unique insights by evaluating digital assets based on their network activity and overall utility.
The formula emulates the popular Price-to-Earnings ratio that is used to analyze stocks. Since digital assets don’t have earnings, we substitute “Earnings Per Share” with “Daily Transaction Value” to get the NVT ratio. Daily Transaction Value represents a coin’s fundamentals or “base utility”: based on our principles above, tokens with higher network activity should generally yield higher prices.
In a Nutshell
The Network Value to Transactions (NVT) Ratio emulates the stock market’s Price-to-Earnings ratio. However, instead of ‘Earnings Per Share’ it uses ‘Daily Transaction Value’ to represents a digital asset’s “base utility” while the market cap measures the network value. Generally speaking, a high NVT Ratio would suggest an asset’s market value is outpacing its utility.
Understanding Network Value-to-Transaction Ratio

First, let’s refresh our understanding of the P/E ratio. Price-to-Earnings is one of the most common ratios used when comparing stocks.
The simple formula divides the price of a stock by the Earnings Per Share of the company. A high P/E ratio could indicate a stock that is overvalued or that investors may expect high growth rates in the future. In contrast, a low P/E suggests that the stock is possibly undervalued, and a company with negative or zero earnings will have a P/E of 0.
P/E is used to compare stocks – apples to apples – to spot companies that might be undervalued or overvalued. Apple (AAPL), for example, ended 2019 with a P/E ratio of 24.7, compared to Amazon at 81.8. Is Apple undervalued, or is Amazon overvalued? That’s where we’d dig further into our analysis.
While digital assets certainly have market prices, they lack the “earnings” half of the equation, so we substitute this with Daily Transaction Value. The total value of transactions occurring over the course of a day should indicate the overall utility that users receive from the blockchain. Having said that, models provided by Clearblocks indicate that using a 90-day moving average of transaction volumes will lead to more accurate results as it encompasses more of the digital asset’s activity in one metric: you smooth out the day-to-day bumps.
Certain coins might have higher transaction volumes: a digital currency, for example, will have more transactions that a digital asset that’s mostly used to store value. The popular stablecoin Tether, for example, handles millions of transactions per day since it was designed for that purpose. Conversely, bitcoin is often used as a store of value.
Furthermore, the NVT ratio accounts for on-chain transactions only, and excludes those that occur off-chain (on exchanges, for example).
NVT Ratio: How It Works
Here’s what goes into the model:
- Price: current market price of digital asset
- Market Cap: the value of the total market (number of coins in circulation x price)
- Transactions last 24hrs: total number of transactions in the past 24 hours
- Average Transaction Value: average dollar value of a single transaction
- Transaction Value Last 24 hrs: Average Transaction Value x Transactions in last 24 hours
- Active Addresses: total number of active addresses (think of this like wallets)
- Metcalfe Ratio (n^2): the total number of active addresses, squared
The NVT ratio is modeled after the P/E ratio. Traditional finance uses these ratios in apples-to-apples comparisons, typically when analyzing companies within the same industry. A P/E ratio can also be used to compare a company against its historical record, allowing for equities analysts to identify price trends based on fluctuations in P/E.
If you asked Willy Woo, the same can be said for cryptocurrencies as well. Woo helped develop the NVT ratio for digital assets, pushing for more analysts to use it as an indicator for price bubbles.

The image above maps Bitcoin’s NVT Ratio and price from 2013 to 2018. It’s astonishing to see that the fortuitous bull run of early 2018 was accompanied by an increase in the NVT as well, serving as a prime example for the powerful insights discovered when using quantitative valuation methods.
The model compares the three most well-known digital assets, each with a similar investor profile. Using data from Bitinfocharts, we can determine each asset’s NVT ratio as of today. Investors can interpret results in a variety of ways, but the fundamentals of the P/E and NVT ratios remain the same.
If you’re looking to buy, lower = better. In other words, a lower NVT ratio indicates that a digital asset is possibly undervalued, relative to its peers. (Just as Apple’s historically low P/E ratio may mean there is a lot more “value” to be unlocked relative to Amazon.)
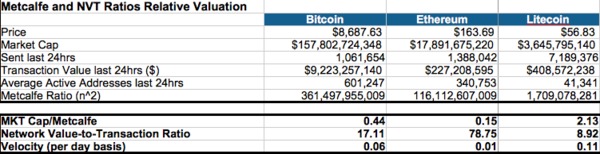
According to this metric, Litecoin looks undervalued by the market while Ethereum looks overvalued. Going back to our initial premise of “healthy economies have lots of users making lots of transactions,” Ethereum has kept a TPS (Transactions per Second) of 7.5 in recent years—while Litecoin, a payment token of choice, averages 56 transactions per second.
Now, let’s apply a common-sense test: if we are trying to measure “flow” of the ecosystem, does Litecoin have more “flow” than Ethereum? The answer is yes. And does the price reflect that flow? The answer is no. Does the ratio then accurately describe what’s going on? The answer is yes.
One caveat, of course, is that different tokens do different things. Ethereum is a digital asset that “fuels” blockchain projects built on the ERC-20 platform, while Litecoin is a payment token. Should Ethereum really be compared to Litecoin? As top-ranked digital assets, we believe it’s a fair comparison, but you may think differently. The principle is to create “buckets” for comparison: in other words, use the NVT Ratio to compare apples to apples.
To use the NVT Ratio to value assets in your portfolio, you can download your NVT Ratio spreadsheet here.
Conclusion
This is blockchain! Avoid simplistic thinking; try to approach blockchain investing from multiple angles. Quantitative metrics should be used as measurements of basic health (like heart rate, blood pressure, and oxygen levels). But just as a doctor would never assess your health only on those three quantitative metrics, we need qualitative analysis (i.e., expert judgement) as well.
To the delight of the public, Bitcoin Market Journal put its analysts to work researching and developing a scorecard that could change the way we value cryptocurrency. Our academically-published, peer-reviewed Blockchain Investor Scorecard lets you analyze the five essential Key Performance Indicators (KPIs) that influence the long-term value of a token or project.
Investors analyzing both the quantitative and qualitative aspects of digital assets will undoubtedly have an edge in this race for value. And there’s one more metric coming next week; stay tuned.
Related Reading:
- How to Use the Network Value-to-Metcalfe (NVM) Ratio to Value Digital Assets
- Digital Asset Valuation: Top 7 Metrics for Valuing Bitcoin, Altcoins, and Cryptocurrencies
- Bitcoin Valuation Spreadsheet: Economists Agree on $13,333.33 (With Downloadable Spreadsheet)
Subscribe to Bitcoin Market Journal to stay up-to-date with the latest trends in digital asset investing.
