
Who doesn’t like free money right?!
Well, it seems that’s just what’s happening here. To be fair, the small economy of Hong Kong has been double shafted. First by months of protest and now from epidemic.

The idea of free money for all is hardly a new concept. Popularly known as Helicopter Money, it was first proposed by our good friend and Nobel Libertarian Milton Friedman during the summer of 1969. Only to later be revived by former Fed Boss Benjamin Bernanke, earning him the nickname Helicopter Ben in 2002.
The vision is simple, if you drop money on people from a helicopter their quite likely to spend it and that will stimulate the economy and boost inflation.
This may seem to make sense for the people of Hong Kong and without a doubt I’m happy that they’re getting something to ease the pain. However, my biggest fear about the economy over the last few months has been the stability of fiat money. The intentional debasement of currency has been perpetuated for a very long time now.
What does it say when the creation of money is trivial that they’re literally giving it away for free?
All Time Lows
Not for the stock market. Far from it. But the recent flight to safety, along with interest rates that have been artificially suppressed for a decade have sent bond yields on the US 10 year treasury to it’s lowest point in history.
You’ll be able to tell your grandkids about this one…
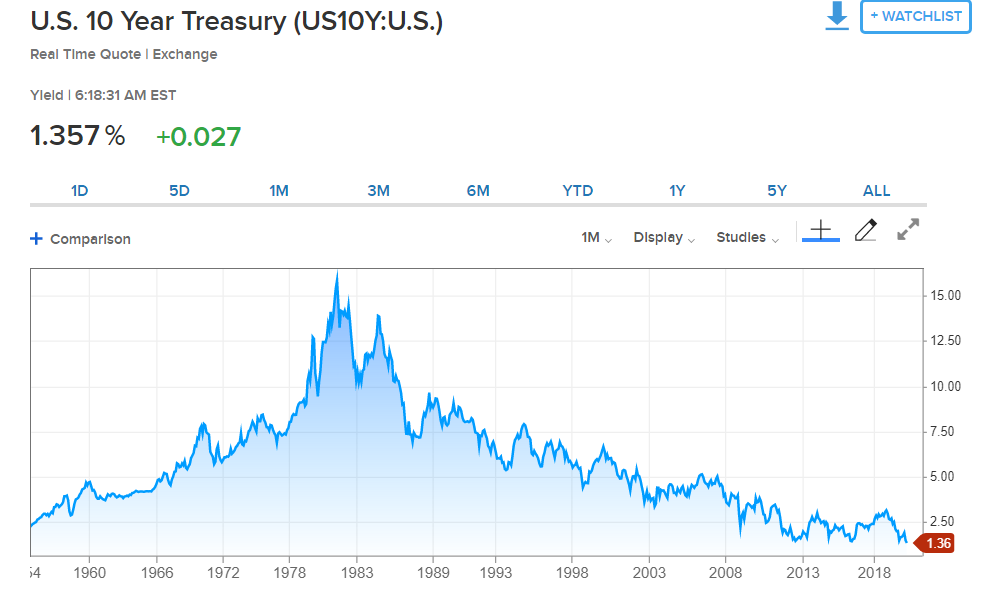
Of course, the way things are going you might need to explain to them what positive interest rates were.
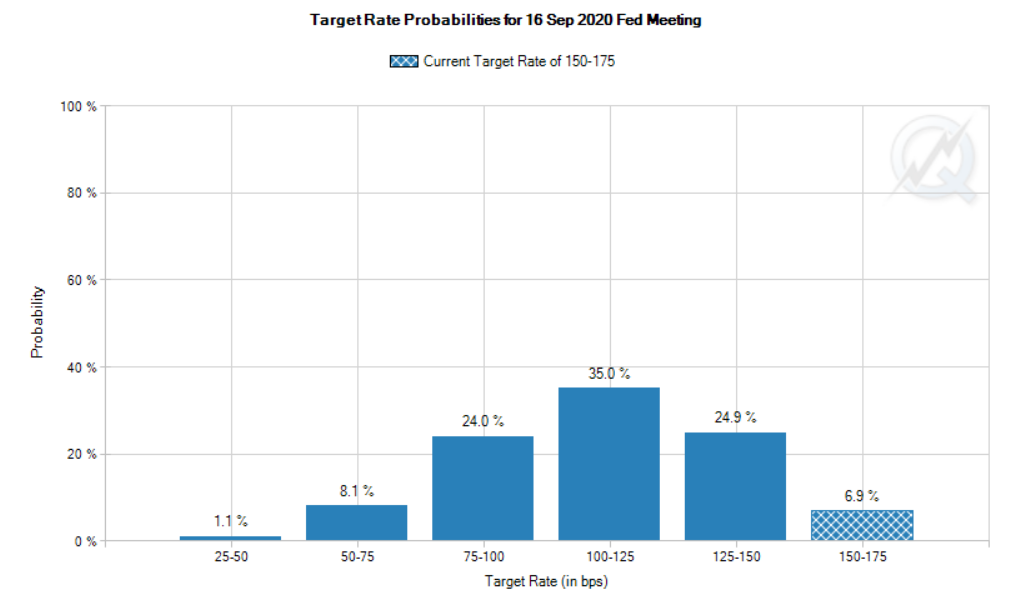
Outstanding pressure is now on the Fed to cut rates at their earliest possible opportunity. Two weeks ago, the market was fairly confident that the Fed would not need to adjust rates at least until after the election, if not longer. Today, the market is pricing in one or two, possibly three rate cuts before November.
As we can see here, the current expectation for the rate to stay as it is now until September is just 6.9%.
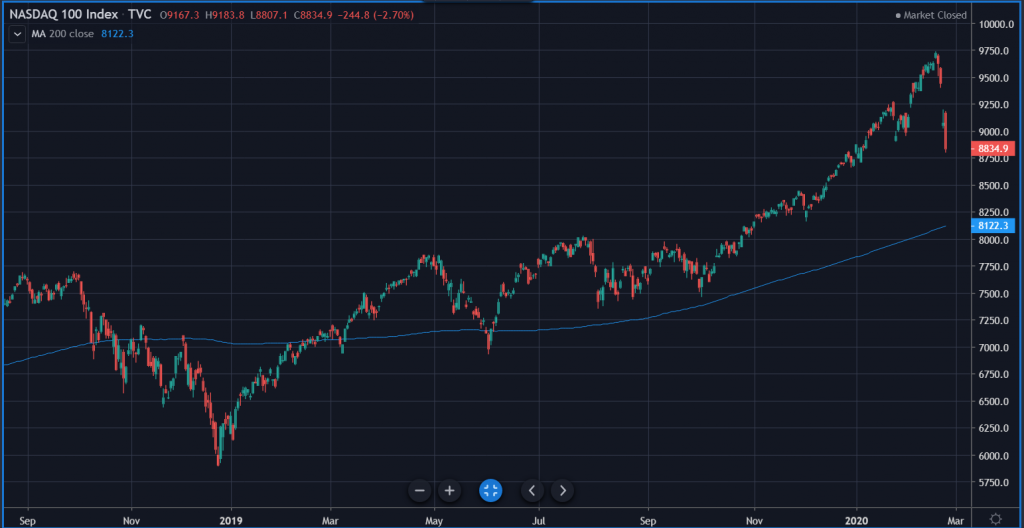
In short, the market is trying to tell the Fed to panic. Yet, at the same time stocks are still priced at some fairly lofty values. The Nasdaq 100 index for example, still isn’t even close to its 200 day average. Investors would love nothing more than to have their cake and eat it too.
Bitcoin Technicals
Many thanks for the warm reception on my theory yesterday. Very glad to hear so many people appreciated my interpretation of bitcoin’s place within the broader financial markets. Today, let’s take a quick look at the graph.
Got a crowded one for you this time so pay attention…
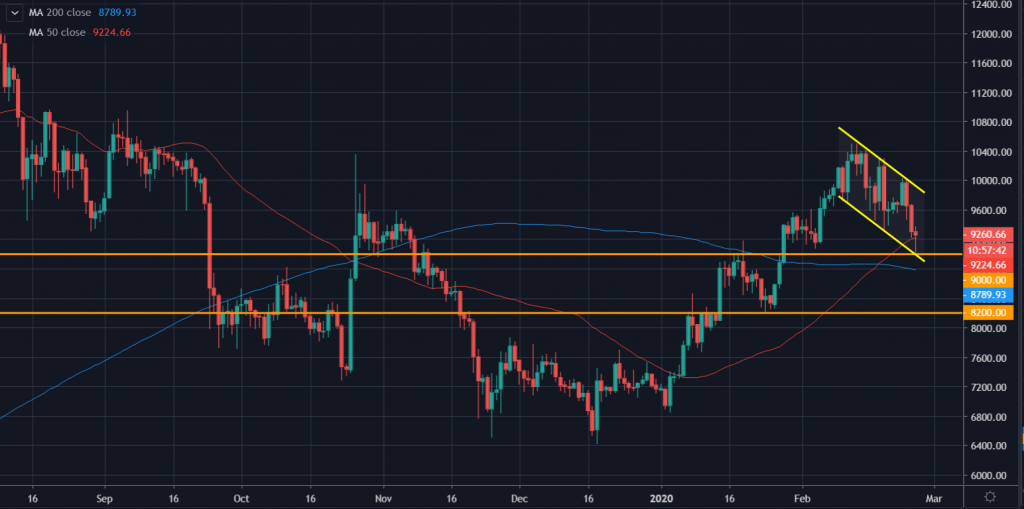
The orange lines are the most logical psychological lines of support. Currently we’re testing $9,000 but if it falls through we have $8,200. The blue line is the famous 200 day moving average, which as we know can also be used as a line of support. The red line crossing over the blue represents a very strong golden cross.
Of course, the yellow lines, which represent the short term range this month and the retracement off the February peak actually look like a bullish flag from this angle.
Call me a permabull if you like. It’s just how I see the graph at the moment. Have a lovely day!!
