
In a Nutshell
Similar to the velocity of money, token velocity measures the number of times a digital asset changes hands. Token velocity is the market capitalization of a digital token divided by the total transaction volume in USD. The higher a digital currency or token’s velocity, the more it is being used.
In our third and final series on digital asset valuation, we will introduce you to the concept of token velocity and how you can apply it to value digital currencies and tokens.
What is Velocity?
Economists and investors use hundreds of metrics to gauge the health of an economy, but none are more well known than the velocity of money. Velocity serves as a measurement of the rate at which money is exchanged within an economy.
Most countries calculate their velocity of money using a ratio that divides Gross Domestic Product by the M1 or M2 money supply. Developed economies – like the United States and Western Europe – tend to display a higher velocity of money, indicating that a healthier economy is directly proportional to a high velocity of money.

The answer rests in the application of the technique, and how we derive a “crypto-friendly” version of the formula. Establishing a proper methodology for computing token velocity is crucial due to its investment implications.
Token velocity affects the long-term, intrinsic value of a token. It can provide powerful insights into the liquidity and overall popularity of a blockchain network.
Understanding Token Velocity
Token velocity, the final piece of BMJ’s short series on valuation metrics, is often misunderstood and underutilized in the blockchain industry.
The ratio for money velocity is derived from the Equation of Exchange, a formula that states asset prices reflect all available information.
The equation of exchanges reads PQ=MV.
The “V” within that equation is token velocity, which is the total transaction volume in USD divided by the market cap of the token. It measures the “speed” of a token, which, in other words, is the number of times it changes hands. Analyzing a token’s velocity helps investors understand the coin’s state of liquidity and its overall usage rate.
The concept of money velocity may appear complex, but rest assured that it remains a simple yet still powerful tool. Nate Nead from InvestmentBank.com claims that “a coin is inversely proportional to the value of the token i.e. the longer people hold the token for, the higher the price of each token.”
He goes on to say that If the transactional activity of an economy is $100 billion (for the year) and coins circulate 10 times each over the course of the year, then the collective value of the coins is $10 billion. If they circulate 100 times, then the collective coins are worth $1 billion. This gives insight as to why tokens with higher transactions per second (TPS) accompanied by higher velocities may have less value, making them premium options for a means of payment rather than a store of value.
Analysis
Method: Token Velocity
Description: “Token velocity is the total transaction volume in USD divided by the market cap of the token.”
Model: The model using the Velocity formula includes a side-by-side comparison with the Market Cap/Metcalfe Ratio and NVT. The model uses a total of seven variables to compute the three ratios in an attempt to value the currencies amongst each other. The data for each currency (as well as your own) can be found at https://bitinfocharts.com/. Users must simply input data for their token of choice and examine the difference between the ratios.
Details: Although the model may appear simplistic, it can yield tremendous insights into the realm of cryptocurrency valuations. Assumptions and formula details for the Velocity formula are described below.
- Price: current market price of cryptocurrency
- Market Cap: the value of the total market or the number of coins circulation x price
- Transaction Value last 24hrs: total value of transactions occurring in the past 24 hours on the network
- Average Transaction Value: average dollar value of a single transaction
- Transaction Value Last 24 hrs: calculated by multiplying Average Transaction Value by Transactions in last 24 hours
- Active Addresses: total number of active addresses
- Volume last 24hrs (USD): total value of transactions occurring in the past 24 hours on the network and exchanges
- Metcalfe Ratio (n^2): calculated by squaring the total number of active addresses
The formula for token velocity is nearly the exact inverse of the NVT ratio with the difference being that token velocity takes exchange transactions into account whilst the NVT ratio does not. The NVT ratio divides a digital asset’s market cap by total unique address transaction value over the course of the past 24 hours. Excluding exchange data makes sense in this case because the NVT ratio attempts to determine the overall health of a blockchain network. Exchange transactions would not be indicative of the health or value of the network, so its best not to include them.
As for token velocity, its vital to include exchange data in order to establish the full scope of a token’s liquidity and activity in the blockchain economy.
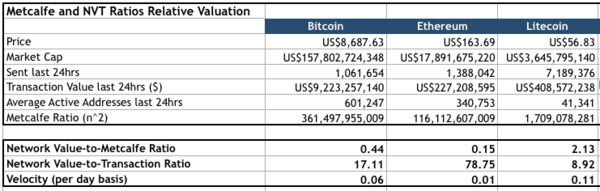
In the BMJ Ratio Model, we found that tokens like bitcoin (BTC) and ether (ETH) tend to yield lower velocities due to certain structural aspects in their design. Educated crypto investors understand that Bitcoin and Ethereum are less capable as a means of transaction due to their low TPS (transactions per second).
Litecoin, a token that produces a solid 56 transactions per second, has a much higher velocity since a vast majority of its users utilize the token as a means of payment. Noting the key differences between the digital assets you compare will help result in more accurate findings as comparing apples-to-apples makes far more sense than comparing apples-to-bananas.
You can download our Token Velocity Valuation Spreadsheet here!
Conclusion
Our three-part quantitative valuation series comes to a close. Now that all the pieces are in place, you should explore the BMJ Ratio Model to enhance your investment analysis. A simple combination of these three ratios can provide deep insights into the intrinsic as well as relative value of a digital asset.
Additionally, you can also use the Bitcoin Market Journal Investor Scorecard to cover the qualitative side of the analysis.
Related Articles:
- How to Use the Network Value-to-Transaction (NVT) Ratio to Value Digital Assets
- How to Use the Network Value-to-Metcalfe (NVM) Ratio to Value Digital Assets
- How to Value Cryptocurrency Using the Blockchain Investor Scorecard
Subscribe to Bitcoin Market Journal to stay up to date with the latest trends in digital asset investing.
