
The price of bitcoin is very volatile compared to established asset classes such as blue-chip stocks, government bonds, and gold. A great way to dial down this “market noise” is to look at a Japanese Renko price chart as opposed to the popular candlestick or line charts to which you are probably accustomed.
What are Renko Charts?
Japanese Renko charts are based solely on price and do not incorporate the factors of time or volume. This is why Renko charts can help to drown out market noise and allow users to focus on price trends that could help to predict where the price of the asset may move next.
Renko charts are based on boxes or bricks that have a predetermined value. For example, one box could be $10. Hence, when the price moves up by $10 more than the previous high, a new “up” box will be generated on the chart. Conversely, if the price drops by more than $10, a “down” box would be drawn.
Trading signals are generated when a trend continues in one direction. Once a trend has been recognized, investors can place their bets according to the direction that the chart is moving.
In the example chart below, you can see the price progression of the SP500 Stock Index in the past twelve months illustrated using a Renko chart. This chart uses 10 points per block.
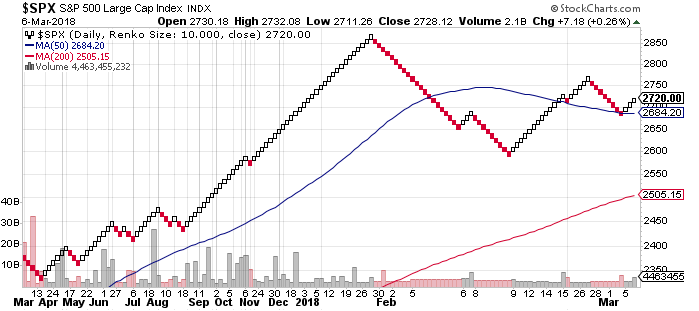
Chart by StockCharts.com
When comparing this chart to a candlestick chart of the same time period and with the same specifications, you can see that the SP500’s volatility could easily distract investors from the long-term trends on which they are betting.
If investors had invested according to the trends that the Renko chart indicated, they would have been able to nicely ride the wave up from mid-August to late January and would have been able to avoid the February crash.
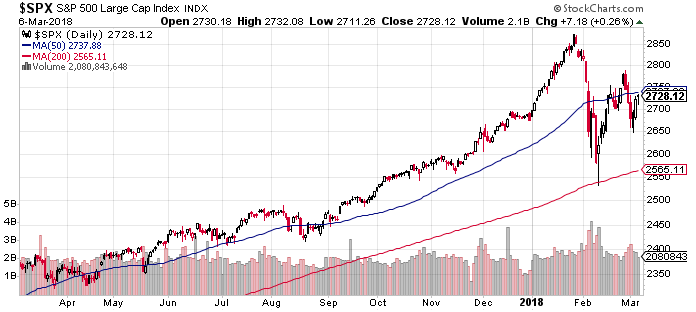
Chart by StockCharts.com
Renko charts are thus a great way to help investors focus on the bigger picture and reduce the chance of being easily swayed by intra-day or intra-week volatility.
How Can Renko Charts Be Used to Trade Bitcoin?
Renko charts can help you to stay focused on the main price trend of bitcoin and avoid the distraction of intraday volatility. Hence, as a trader, you can use the Renko chart to stay long as long as the trend is going up and then sell or go short when the trend is going downward.
For an asset class like bitcoin, which experiences regular price shocks, using the Renko chart as an additional tool to make investment decisions can turn out to be very valuable as it helps you to focus on the key trends in the digital currency’s price action.
It is important to note, however, that when using a Renko chart, as with all chart analysis tools, the specifications you set up for the chart will determine how accurate its predictive abilities will be. Hence, when using a Renko chart while trading bitcoin, it is important to first test various specifications, such as the box values, before using this chart as a key tool in your investment arsenal.
To learn more about how to invest in bitcoin and bitcoin investment tools, subscribe to the Bitcoin Market Journal newsletter today!
