
What a thing of beauty! When you wait patiently for something very specific to happen and then it does. Since I’m a bit of a geek, this of course has to do with the charts and I can now say that bitcoin’s breakout has been completely confirmed.
We’ll get into the various reasons for the movement below, but from the technical side and what we’re seeing on the charts, the breakout is pure. If you’ve been following us for a while, you’ve probably already seen this interview with from two weeks ago with Jessica Walker from AIBC. If you haven’t go back and watch it now.
In it we discuss a downward facing channel (yellow lines) that have been in place for the past few months as well as the 200 Day Moving Average (blue line). Both of these barriers have now been completely pulverized!!
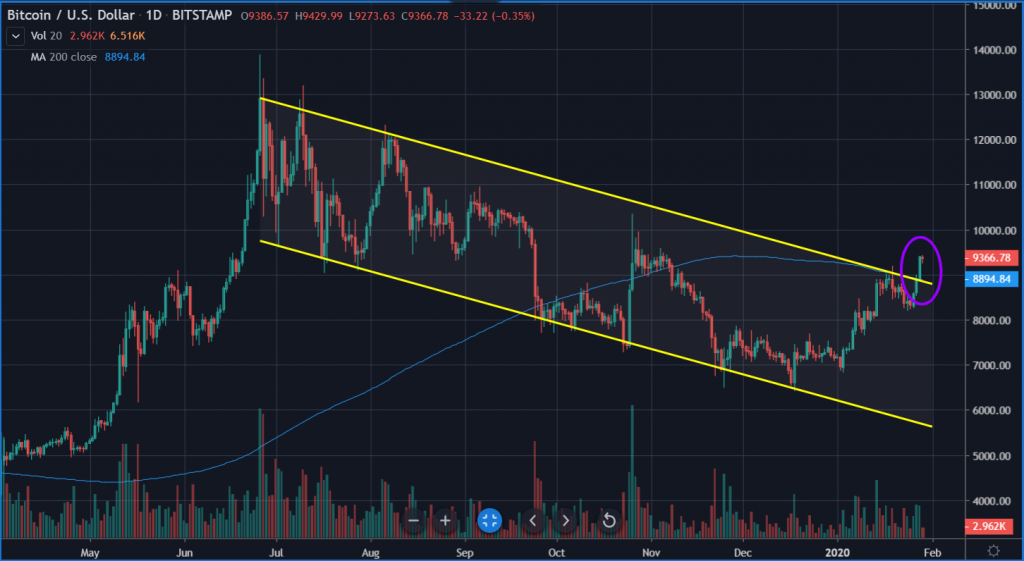
Now, past performance is not an indication of future results and this is obviously not a guarantee that it will continue in the direction of the breakout but as far as technical analysis is concerned, it doesn’t get much more bullish than this.
Several have already pointed out to me that the we’ve recently seen several false breakouts and so it’s possible that this will be reversed too. However, I would argue that it’s a lot less likely this time. Simply for the fact that unlike the late-October Xi-boom, for example, this move has happened more gradually, allowing the market to really give a proper timely test of the relevant price levels.
I’ve seen it happen several times in my career, where a large move was widely anticipated by the market but is really taking it’s time. Then, when the technical breakout finally occurs there’s a moment, or a day, or even a few days of shock and disbelief to see it’s really happening. It’s really awesome to watch.
The Fed Needs a Beer
The affects of the Coronavirus on the stock market are already starting to dissipate as investors return their focus to earnings season and more importantly to the Federal Reserve’s upcoming interest rate announcement and press conference that is scheduled for 2:00 PM in New York today.
At the moment, the market is fairly certain that the Fed will choose not to adjust their interest rates this time around. In fact, at this point in time the market is fairly certain that the Fed will not change their interest rates, up or down, throughout the first half of the year.
What’s far more interesting at this point is the current operations they’re doing in the repo market and artificially growing their own balance sheet. Several articles have already been written wondering if the Fed will use the Coronavirus in China as an excuse to continue feeding money to the markets. Well, I’d like to know that as well.
The World Health Organization has been very hesitant to label this as an international emergency and indeed there have been very few cases where the virus was contracted outside of China and thankfully zero deaths have occurred outside of the mainland. If the Fed does mention Coronavirus as a risk that requires them to leave their heavy thumb on the Dollar printing machine, then it will be a very clear display of just how frivolous they’ve been lately.
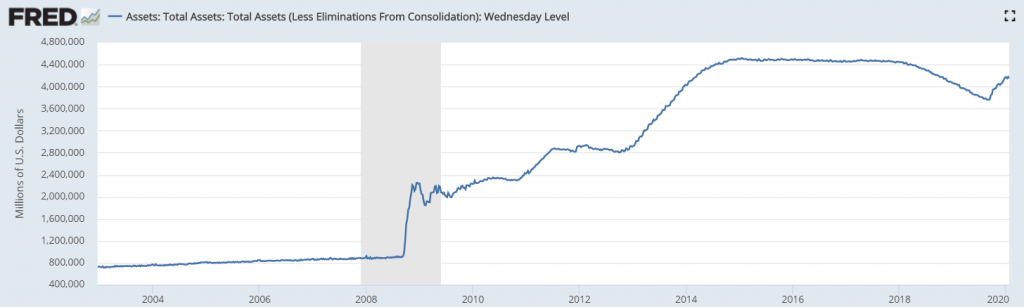
In this graph, we can see the Fed’s overall balance sheet, which has been ballooned by QE. Notice that at the beginning of last year, they did make a serious attempt to unload some of it, but since September have once again been expanding, despite the fact that the economy is doing fine, the labor market is strong, and inflation is exactly on target. At this point, it’s just pure market manipulation, but I digress.
What are the Reasons?
The first thing to note about last night’s double breakout was that it happened on strong volumes. According to Messari data, the top 10 exchanges have seen more than $1.3 billion worth of bitcoin changing hands. Paper contracts at the CME group were higher than they’ve been in a while, topping out at about $800 million and Bakkt’s physically settled contracts were not spectacular but at least higher than average at $11 million for the day.
What remains amusing to me is that we’ve seen a deterioration in the correlation between price volatility and transactions on bitcoin’s blockchain. In this graph we can see that the main chain has seen very consistent volumes since the start of the year, remaining well within the $500 million to $2 billion range, and lately this range has narrowed and now largely remains between $1 billion $1.5 billion per day.
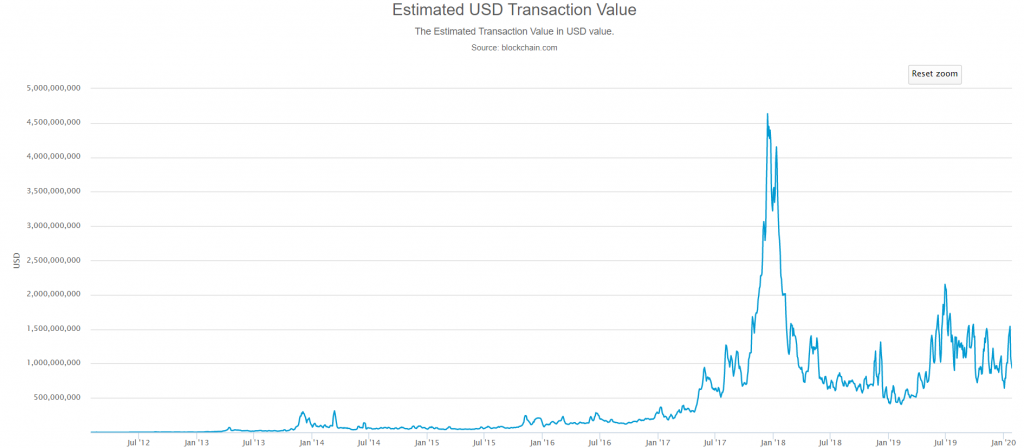
What this tells us is that those who are trading actively on bitcoin, no matter what venue, are likely not settling their transactions back to an actual wallet. Therefore, we can probably conclude that a lower percentage of on-chain transactions can be attributed to short term speculation.
With just 103 days left to bitcoin’s halving, it’s clear that many people are getting excited already. IMHO, this remains one of the strongest divers from a fundamental perspective. That and the Fed continuing to push money into the markets, as mentioned above.
In addition, there does seem to be a lingering sensation that bitcoin may be transitioning into a traditional safe haven asset. It doesn’t seem like it’s quite there just yet, but there are clear indications that it’s at least moving in this direction.
Last but not least, the prospect that bitcoin may soon see a major upgrade called taproot is definitely cause for excitement. It’s still early in the process but every day that goes by without any major objections to taproot brings us closer to scaling bitcoin.
