

Bitcoin Market Journal understands that professional traders use complex financial models and real-time data to determine their digital asset investments, but why should they be the only ones?
The constant “guesswork” in the digital asset investment industry removes legitimacy and should rarely be a factor when playing in such a risky market. Even novice investors should have the option of exploring multiple quantitative valuation methods prior to putting money on the line. Recognizing the gaping hole in the market, BMJ has started an ongoing series of crypto evaluation articles that will assist investors as they determine the value of the constituents of their digital asset portfolios.
In this article, you will learn how you can use the Network Value-to-Metcalfe Ratio to compare how overvalued or undervalued a digital asset is compared to its peers.
In a Nutshell
Metcalfe’s law states the effect of a telecommunications network is proportional to the square of the number of connected users of the system, i.e. it is a measure of “network effect.” The Network Value-to-Metcalfe (NVM) Ratio divides the market cap of a digital asset by its Metcalfe value (determined by the number of active addresses squared) to determine the value of an asset in relation to its network effect. The higher the NVM Ratio, the more an asset is currently trading at compared to the number of active users it has. A high NVM ratio could suggest that an asset is either overpriced in relation to its active users or that high expected user growth is priced in.
Understanding Metcalfe’s Law

The first valuation method we will explore is Metcalfe’s Law. Created by Robert Metcalfe and later expanded upon by George Gilder, Metcalfe’s Law states that the effect of a telecommunications network is proportional to the square of the number of connected users of the system (n^2).
The law was initially applied to fax machines at Xerox and was later linked to platforms such as Facebook and Ebay due to their reliance on networks and the internet.
A study conducted by Xing-Zhou Zhang in 2015 found that Facebook’s revenue was almost exactly proportional to its number of monthly active users squared, indicating that an increase in users will inherently lead to an increase in utility and value. The same can be said of Bitcoin as it operates on the same network premises as Facebook, creating a more valuable platform as more nodes (users) join.
However, applying Metcalfe’s Law to digital assets is not an exact science, opening doors for a variety of interpretations.
To justify using Metcalfe’s Law, it’s critical to establish the value gains from an increase in nodes within the network. As a payment system, Bitcoin’s network is one of the largest, resulting in a much higher price than other coins since merchants and patrons alike will prefer a payment system with more activity. An increase in users also leads to more stability as coins with larger market caps tend to hold their value in the long term, easing worries of wild price fluctuations. Lastly, Bitcoin’s network will be less susceptible to security breaches with more nodes. Bitcoin is the world’s most secure blockchain network due to its total accumulated hashes, which will only increase as its user base grows.
Analysis
Method: Metcalfe’s Law Comparative Valuation
Description: “Metcalfe’s law states the effect of a telecommunications network is proportional to the square of the number of connected users of the system (n2).”
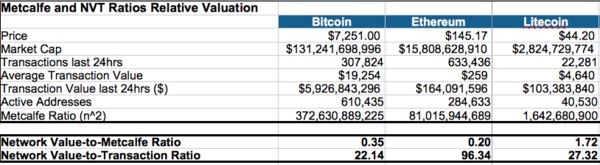
Model: The model using the Metcalfe Law formula includes a side-by-side comparison of the Network Value-to-Transaction Ratio as well. The model uses a total of seven variables to compute the two ratios in an attempt to value the currencies amongst each other. A major caveat in this and nearly every other digital asset analysis is the ability to collect reliable data. We have found that BitInfoCharts has a decent and relatively accurate database for a plethora of variables. The data for each asset (as well as your own) can be found at https://bitinfocharts.com/.
You simply input data for your asset of choice and examine the difference between the ratios in the downloadable NVM Ratio spreadsheet.
Details: Although the model appears facile, it yields tremendous insights into the realm of digital asset valuations. The assumptions and formula details for the the Network-Value-to-Metcalfe ratio are described below.
- Price: current market price of cryptocurrency
- Market Cap: the value of the total market or the number of coins circulation x price
- Transactions last 24hrs: total number of transactions occurring in the past 24 hours
- Average Transaction Value: average dollar value of a single transaction
- Transaction Value Last 24 hrs: calculated by multiplying Average Transaction Value by Transactions in last 24 hours
- Active Addresses: total number of active addresses
- Metcalfe Ration (n^2): calculated by squaring the total number of active addresses
Network Value-to-Metcalfe (Users): Equity analysts use a variety of metrics that include market capitalization when valuing stocks. One of the most crucial ratios is the price-to-book value, which is calculated by dividing the market cap by total shareholder equity (the balance of total assets and total liabilities). The coins we seek to value lack the convenience of clear cash flows, assets, liabilities, and other data points. Therefore, we must substitute certain variables in order to find equitable ratios.
Our first obstacle is the shareholder’s equity as no digital assets have any form of assets or liabilities. Having said that, we can assume no liabilities for decentralized digital assets since they clearly have no short or long term outstanding debt. As for the assets, we can refer to Metcalfe’s Law to find a suitable substitution.
Assuming the value of a network is proportional to the number of active users squared, we can replace “book value” with Metcalfe’s Law, or the total number of Active Addresses squared. Note that we must use active addresses since an inactive one provides no value to the network.
The result is a ratio that emulates a common company’s Price-to-Book value. If investors are unfamiliar with interpreting the ratio, there’s no reason to panic. A higher P/B ratio indicates that the market is paying a premium price for a stock as its share price is higher than the “book price”, which is the actual value of all the companies assets if liquidated on the spot.
Companies such as Apple and Amazon often have high P/B ratios due to the market’s forward-thinking mindset, assuming that the company’s future value is worth even more than its current assets. In contrast, a low P/B ratio could indicate a stock that is undervalued in the market, revealing a potential buying opportunity.
The same principles apply to digital assets when using the Network Value-to-Metcalfe ratio.
Conclusion
The perfect valuation method will likely never exist, especially for assets as complicated as digital currencies. Having said that, we can still seek reliable data and intuitive formulas to add quantitative understanding when choosing our investments. The purpose of the Ratio Comparison Model is to provide investors reliable metrics that can assist in determining the current and future values of digital assets. Investors should be sure to read BMJ’s other articles regarding the valuation of cryptocurrencies for a comprehensive overview of available quantitative metrics.
Download the NVM Ratio Calculation Spreadsheet FOR FREE and input the assets from your portfolio to calculate individual Network Value-to-Metcalfe ratios.
Related Articles:
- Blockchain Investing 101
- How to Double Stock Market Returns
- Facebook Coin: How to Invest in Libra, Facebook’s New Cryptocurrency
Subscribe to Bitcoin Market Journal to stay up to date with the latest trends in digital asset investing.
